Mapping Pathways to Building Collective Black Wealth
By: Miriam Van Dyke, PhD & Alex Camardelle, PhD
At Kindred Futures, we are focused on creating innovative community wealth-building solutions to uplift the Talented 90th, a broad base of Black households, including the nearly 2 million Black households in the American South with zero or negative net worth. This means advocating for the scalability of innovative and reparative initiatives for Black families. To understand which solutions are the most impactful, it is important to first understand the underlying historical and present-day determinants and drivers impacting the ability of Black communities to create, protect, and sustain wealth.
To do this, Kindred Futures worked with PolicyMap to build the Mapping Black Wealth Pathways tool, showing how economic policies (e.g., state minimum wage laws) and opportunities (e.g., jobs and wages), and environmental (e.g., climate burden), health (e.g., healthcare access), and living (e.g., housing affordability) conditions are spread across communities and providing or extracting opportunities to build wealth. While many of these data points describe negative conditions, we see them as an opportunity to identify and tailor solutions to support Black communities on their pathway to building collective wealth.
Click on INDICATORS and get started exploring your community today.
To get the scoop on how Kindred Futures selected these data points, read on!
Pro tip: zoom in and out to view data indicators across various geographic levels (e.g., state, county, zip code tabulation area, and census tract).
Kindred Futures R3 Framework: Revenue, Resilience, and Repair
Data points for the Mapping Black Wealth Pathways Tool were selected to reflect the Kindred Futures R3 Framework: Revenue, Resilience, and Repair.
At Kindred Futures, the R3 framework—Revenue, Resilience, and Repair—grew out of both rigorous research and intentional community listening. In conversations with Black families across the South, we consistently heard that wealth is not simply about assets, but about freedom: the freedom to choose, to secure a future for one’s children, and to thrive without fear of exploitation or loss. Sitting with this wisdom alongside the data, we came to understand that achieving Black prosperity requires a framework broad enough to confront the structural determinants of wealth. R3 reflects that understanding: we must generate new income and assets through Revenue, safeguard those gains through Resilience, and pursue systemic Repair for the harms of dispossession and exclusion. Together, these pillars embody both the urgency of redress and the promise of building lasting, liberatory wealth for Black communities.
The Revenue Pillar focuses on Creating Pathways for Growth and Income to Build Black Economic Power.
- The Revenue pillar of the R3 strategy is about creating robust pathways for economic growth, asset-building, and income generation in Black communities. This means investing in Black-owned businesses, entrepreneurship, homeownership, and good jobs as engines of wealth creation. Kindred Futures advances research and policies that expand access to capital for Black entrepreneurs, support Black business development, and reduce barriers that have historically stifled Black enterprise. For example, it backs initiatives like Black business incubators, equitable entrepreneurship training, and special-purpose credit programs that provide financing to Black start-ups. By promoting worker justice (supporting good wages, benefits, and collective bargaining), ensures that Black workers share in economic growth. All these efforts align with Kindred Futures’ priority of expanding Black incomes and assets, measured by indicators like rising Black business ownership rates, higher earnings from work, etc.
The Resilience Pillar focuses on protecting and preserving Black wealth, including safeguarding homes, communities, and assets.
- The Resilience pillar of the R3 strategy is about research and policies that center on protecting existing Black wealth from systemic threats, displacement, and financial exploitation. LEAD’s strategy here is about fortifying the defenses around Black-owned homes, land, businesses, and savings so that hard-won gains are not eroded. This involves advocating for strong anti-displacement policies – for instance, tenant protections and anti-eviction measures to keep Black renters from unjust removal, rent control policies to prevent profiteering in gentrifying neighborhoods, and heirs’ property reforms to help Black families secure clear title to ancestral land and homes. The resilience work also tackles predatory financial practices: pushing for consumer financial protections and regulation of payday lenders, mortgage fraud, and other exploitative schemes that often target Black households. Additionally, this pillar embraces climate resilience strategies – recognizing that environmental threats (floods, hurricanes, extreme heat) disproportionately impact Black families and can literally wash away Black wealth. By promoting equitable climate adaptation (like infrastructure investments and insurance support in Black communities) alongside social safety nets and healthcare access.
The Repair Pillar focuses on addressing historical injustices and closing the wealth divide, allowing for a reckoning with the past to invest in the future.
- The Repair pillar of Kindred Futures’ R3 strategy directly confronts the legacy of racial injustice that has stripped wealth from Black Americans for generations and pursues reparative investments to rectify those disparities. This means pushing beyond incremental progress and seeking transformative change that returns wealth and resources to Black communities. The R3 strategy promotes formal reparations programs at the national, state, and local levels – policies that would provide compensation or restitution for the enormous economic harms of slavery, segregation, redlining, and other racist policies. Such reparations could take the form of direct payments, housing grants, educational scholarships, or community investments targeted to descendants of those who suffered economic losses. In addition, this includes the impact of land and property reclamation initiatives: efforts to restore land ownership or property rights to Black families who were dispossessed. This includes everything from securing the return of stolen land (for example, recent cases where cities have returned property taken from Black owners generations ago) to reforming laws so Black landowners (like heirs’ property holders in the South) can reclaim and keep their land. Another key area of Repair is debt forgiveness – advocating for canceling or alleviating debts that disproportionately burden Black households. Lastly, Repair represents Kindred Futures’ leading research and advocacy on baby bonds and children trust accounts in the South, which we promote as universal investment vehicles that are reparative.
Mapping Black Wealth Pathways Tool in Action
The Mapping Black Wealth Pathways Tool opens with the percent of households with a Black householder that are unbanked using data from 2019-2023 across 9 American South states. However, we know that it is not that straightforward. Historical exclusionary policies, practices, and legislation have placed Black communities at an economic disadvantage and have created barriers to banking and accessing credit with favorable terms. For example, majority Black neighborhoods (census tracts) are less likely to have a bank branch than non-majority Black neighborhoods. Conversely, Kindred Futures has found a higher density of predatory financial institutions (e.g., payday lenders and title pawn retailers) in Atlanta’s predominantly Black neighborhoods which offer alternative financial services, including high-interest loans and substandard products that trap Black families in cycles of debt and extract wealth.
Zooming in, you are able to explore the complex dynamics influencing the ability of communities at different levels (e.g., census tract, county, zip code) to build wealth and economically prosper. For example, in Atlanta, GA, the story of historical exclusion and its present-day impacts are evident when exploring grades assigned to neighborhoods by the Home Owners Loan Corporation (HOLC) between 1935-1940 (see Repair tab) (more info on HOLC grades indicator). These grades reflected “mortgage security” and influenced the likelihood of banks and other mortgage lenders to provide loans and determined investment safety. To say the least, these grades were racially discriminatory as they used the racial composition of neighborhoods in grade calculations, giving lower grades to areas with greater concentrations of Black and immigrant residents. While the City of Atlanta is facing gentrification pressures, disproportionately displacing Black residents, it is evident that Black residents still largely reside in historically redlined areas and may continue to face limited access to credit (see Demographics tab).
Historical redlining has helped to reinforce the deep racial wealth divide, creating a present-day paradoxical situation in some redlined communities where the historical building of wealth from homeownership has been limited, and yet these communities also hold relatively more affordable housing and provide an opportunity for entry to homeownership. The map below shows the median value of owner-occupied homes in areas (see the Repair tab). Explore the Resilience tab to also see the spatial distribution of homes that are likely affordable for a 4-person family earning 50% of the area median income.
However, communities with relatively more affordable housing need proactive protections and supports for residents with lower incomes and business owners at risk of displacement. Communities also need more than just affordable housing to thrive. They need access to good jobs and other economic opportunities and supports. For example, the lower job opportunity and greater average travel time to jobs (mapped below, see Revenue tab) are yet another symptom of chronic economic disinvestment in some of Atlanta’s majority Black neighborhoods.
Revenue Data Indicators
U.S. Department of Labor
Domain: Income
Data Label: State minimum wage as of January 1, 2022
Data Definition: State minimum wage as of January 1, 2022. The federal minimum wage is $7.25. Some states have legislated higher minimum wages, and some have lower minimum wages. Where the state minimum wage is lower than the federal minimum wage, the state’s is superseded by the federal, which is shown here. Where the state minimum wage is higher than the federal, the state’s minimum wage supersedes the federal. Some municipalities and counties have a minimum wage higher than the state’s; these are not seen here. Minimum wages seen here apply to nonsupervisory, nonfarm, private sector employment. (see data dictionary)
IRS
Domain: Retirement
Data Label: Average amount of IRAs, pensions, or annuities on income tax returns in 2021
Data Definition: Average amount of IRAs, pensions, or annuities on income tax returns in 2021. Average amount of IRAs, pensions, or annuities reported on 1040, 1040A, and 1040EZ forms filed with the IRS for the tax year 2021. Average includes only returns with IRAs, pensions, or annuities. The average is suppressed where fewer than 10 returns are filed with IRAs, pensions, or annuities. (see data dictionary)
Census
Domain: Employment
Data Label: Estimated percent of people aged 16 years or older who were unemployed, between 2019-2023
Data Definition: Estimated percent of civilian people age 16 years or older in the labor force who were unemployed, between 2019-2023. Civilians are defined as those not serving in the armed forces. Percentage calculations are suppressed in cases where the denominator of the calculation was less than 10 of the unit that is being described (e.g., households, people, householders, etc.). (see data dictionary)
LEHD
Domain: Employment
Data Label: Number of non-federal jobs in all industries in 2022
Data Definition: Number of non-federal jobs in all industries in 2022. Data that includes federal employees is available stating in 2010. Available data for years prior to 2010 includes only employees of private firms and state and local governments. Data are not available for all states in all years. (see data dictionary)
Census
Domain: Access
Data Label: Estimated average travel time to work in minutes in 2019-2023
Data Definition: Estimated average travel time to work in 2019-2023. The average travel time to work is the number of minutes required to reach place of employment for workers age 16 years or older. Averages are suppressed in cases where the sample of the average was less than 10 of the unit that is being described (e.g., households, people, householders, etc.). (see data dictionary)
Community Reinvestment Act (CRA)
Domain: Business
Data Label: Average amount of small business loans in 2023
Data Definition: Average amount of small business loans in 2023. These figures were reported under the Community Reinvestment Act (CRA). CRA data captures the lending activity of financial institutions with one billion dollars or more in holdings. Therefore, it may understate total lending, especially in rural areas in which top lenders may be smaller in asset size and, thus, not required to report. Census tract values may not sum to county values. (see data dictionary)
United States Small Business Administration (SBA)
Domain: Business
Data Label: Small business development centers
Data Definition: Small Business Development Centers (SBDCs) help small business and entrepreneurs with free business consulting and low-cost training services including business plan development, manufacturing assistance, financial packaging and lending assistance, exporting and importing support, disaster recovery assistance, procurement and contracting aid, market research help, 8(a) program support, and healthcare guidance. SBDCs are hosted by universities and state economic development agencies, and funded through a partnership with SBA. (see data dictionary)
InBIA
Domain: Business
Data Label: Business Incubators
Data Definition: The International Business Innovation Association is a trade group serving over 2,100 business incubators and related organizations worldwide. Business incubators are programs that provide support services and resources for entrepreneurial companies during their “start-up” phase. InBIA provided PolicyMap with a list of business incubators in the United States. (see data dictionary)
CDFI Fund
Domain: Banking
Data Label: Certified CDFIs (2025)
Data Definition: The Community Development Financial Institutions (CDFI) Fund, a division of the US Department of the Treasury, supports and invests in Community Development Financial Institutions through the CDFI Program and Native American CDFI Assistance Program. CDFIs are financial institutions that provide products and services in economically distressed target markets. The CDFI Fund certifies CDFIs through an application process on a rolling basis, depending on the type of institution. Not all CDFIs are certified, but certification is a requirement for some federal program funding. PolicyMap was able to locate 83% of CDFI addresses on a map. Data on certified CDFI locations are updated twice annually. (see data dictionary)
BLS Quarterly Census of Employment and Wages
Domain: Employment
Data Label: Average annual wage across all goods-producing industries in 2023
Data Definition: Average annual wage across all goods-producing industries in 2023. Wage and employment totals are from quarterly tax reports submitted to State workforce agencies by employers under State Unemployment Insurance (UI) laws. This is total wages reported for all employees divided by the average monthly employment reported throughout the year. Data do not include public-sector government employees. Any location for which the number of jobs is not available is displayed on the map as having Insufficient Data. (see data dictionary)
BLS Quarterly Census of Employment and Wages
Domain: Employment
Data Label: Average annual wage across all service-providing industries in 2023
Data Definition: Average annual wage across all service-providing industries in 2023. Wage and employment totals are from quarterly tax reports submitted to State workforce agencies by employers under State Unemployment Insurance (UI) laws. This is total wages reported for all employees divided by the average monthly employment reported throughout the year. Data do not include public-sector government employees. Any location for which the number of jobs is not available is displayed on the map as having Insufficient Data. (see data dictionary)
PolicyMap and ACS
Domain: Homeownership
Data Label: Homeownership gap between Non-Hispanic White homeowners and Black or African American homeowners, between 2019-2023.
Data Definition: Homeownership gap between Non-Hispanic White homeowners and Black or African American homeowners, between 2019-2023. The US Census Bureau identifies the householder as the person in whose name the home is owned, being bought, or rented. If there is no such person present, any household member 15 years and older can serve as the householder for the purposes of the Census. Percentage calculations are suppressed in cases where the denominator of the calculation was less than 10 of the unit that is being described (e.g., households, people, householders, etc.). PolicyMap calculated the gap using percent of owner households by race subtracted from percent of Non-Hispanic White owner households. (see data dictionary)
Resilience Data Indicators
PolicyMap, Census, and HUD
Domain: Housing affordability
Data Label: Percent of all homes that are likely affordable for a 4-person family earning 50% of AMI between 2019-2023
Data Definition: Percent of all homes that are likely affordable for a 4-person family earning 50% of AMI between 2019-2023. Likely affordable owner-occupied housing units are considered those valued at or less than roughly three times the 4-person family income. For example, a family with an income of $30,000 could afford to purchase a home valued at less than $90,000. These estimates provide information on relative availability of home ownership opportunities in different areas of the country, and can highlight any needs or shortcomings in the locally available housing stock of a given area. PolicyMap created these affordability estimates using publicly available data on incomes and housing costs. Area Median Income is the median income for a family of a specified size within the county, metropolitan area, or state, as published by HUD in 2023. Housing cost data is comprised of the estimated number of homes under specific dollar value thresholds from the Census’ 2019-2023 American Community Survey. For more information please see the data directory. Areas for which data was not reported or for which data could not be assigned are displayed as having ‘Insufficient Data’ in the map. (see data dictionary)
PolicyMap, Census, and HUD
Domain: Housing affordability
Data Label: Percent of all two-bedroom rental units that are likely affordable for a 4-person family earning 30% of AMI between 2019-2023.
Data Definition: Percent of all two-bedroom rental units that are likely affordable for a 4-person family earning 30% of AMI between 2019-2023. These estimates provide information on the relative affordability of rental housing in different areas of the country, and can highlight any needs or shortcomings in the locally available rental housing stock of a given area. PolicyMap created these affordability estimates using publicly available data on incomes and rental prices. Area Median Income is the median income for a family of a specified size within the county, metropolitan area, or state, as published by HUD in 2023. An estimated count of homes under specific dollar thresholds is taken from the Census’ 2019-2023 American Community Survey. Apartment size (number of bedrooms) needed by a family was assigned based on two people per bedroom. For more information please see the data directory. Areas for which data was not reported or for which data could not be assigned are displayed as having ‘Insufficient Data’ in the map. (see data dictionary)
Census
Domain: Housing affordability
Data Label: Estimated percent of all renter-occupied housing units with a householder who is Black or African American, where housing costs exceed 30 percent of household income, between 2019-2023
Data Definition: Estimated percent of all renter-occupied housing units with a householder who is Black or African American, where housing costs exceed 30 percent of household income, between 2019-2023. Percentage calculations are suppressed in cases where fewer than 10 of the unit that is being described (e.g., households, people, householders, etc.) are present. (see data dictionary)
CDC PLACES
Domain: Housing Affordability
Data Label: Crude percent of utility services threat in the past 12 months among adults in 2022
Data Definition: A multi-level regression and post-stratification approach was applied to BRFSS and ACS data to compute a detailed probability among adults who reported that an electric, gas, oil, or water company threatened to shut off services at any time during the prior 12 months.
The probability was then applied to the detailed population estimates at the appropriate geographic level to generate the prevalence. (see data dictionary)
Federal Reserve Bank of NY
Domain: Credit
Data Label: Tiers of Relative Credit Security
Data Definition: Tiers of Relative Security. Credit Insecurity Index scores are assigned to tiers of relative severity: Credit Assured, Credit Likely, Mid-Tier, Credit At Risk, and Credit Insecure. These ranges are determined by using the quintiles of county-level Credit Insecurity Index scores. According to the Federal Reserve Bank of New York, 2018 is used as the base year of calculation, meaning the tiers are based on the county-level Index scores from that year. This allows the number of counties in each tier to change in subsequent years. The Tiers and the Index Score Ranges are defined as follows:
- Credit Assured: 0 – 16.6
- Credit Likely: 16.7 – 21.7
- Mid-Tier: 21.8 – 26.4
- Credit At Risk: 26.5 – 32.5
- Credit Insecure: 32.6 or above.
These tiers offer another dimension of categorical information to demonstrate how credit constrained a community is relative to other communities in the United States. (see data dictionary)
IRS
Domain: Tax Credit
Data Label: Percent of income tax returns with earned income credit (EITC) in 2021
Data Definition: Percent of income tax returns with earned income credit (EITC) in 2021. Percent of all 1040, 1040A, and 1040EZ forms filed with the IRS with earned income credit (EITC) reported for the tax year 2021. The EITC is a refundable federal income tax credit for low-income working individuals and families. Total and average amounts include both refundable and non-refundable portions of the credit. More information is available from the IRS. The percent is suppressed where fewer than 10 total returns are filed. (see data dictionary)
EPA CIMC
Domain: Environment
Data Label: Brownfields (2023)
Data Definition: The EPA regularly updates its Brownfields Sites Report List. The points in PolicyMap are as of April 2024. The coordinates used in PolicyMap are provided by the EPA. PolicyMap removes points that do not appear in the site’s listed state. The points shown on PolicyMap include brownfield sites that have received assessment, cleanup, and/or redevelopment funding from the EPA. Brownfields designated by states or local entities, sites that may qualify for but have not received EPA assessment funding, and underground storage tanks are not included on the map. Each point represents a transfer of funds related to a known brownfield site. Multiple points for the same brownfield location indicate multiple actions over a period of time; the entity receiving funds may differ. (see data dictionary)
CDC & ATSDR
Domain: Environment
Data Label: Environmental Justice Index (EJI) Environmental Burden Module
Data Definition: The Environmental Burden Module (EBM) contains environmental indicators that either cause pollution or otherwise negatively affect human health. The EBM contains indicators relating to air pollution, potentially hazardous and toxic sites, the built environment, pollution related to transportation, and water pollution. The Environmental Justice Index (EJI) scores census tracts using a percentile ranking which represents the proportion of tracts that experience cumulative impacts of environmental burden and injustice equal to or lower than a tract of interest. A higher percentile rank means the tract faces more severe impacts relative to other tracts nationwide. (see data dictionary)
CDC & ATSDR
Domain: Environment
Data Label: Environmental Justice Index (EJI) Climate Burden Module
Data Definition: The Climate Burden Module (CBM) contains environmental indicators that are or have been influenced by climate change, such as extreme heat and wildfires. The CBM contains indicators relating to heat, wildfires, and extreme events. The Environmental Justice Index (EJI) scores census tracts using a percentile ranking which represents the proportion of tracts that experience cumulative impacts of environmental burden and injustice equal to or lower than a tract of interest. A higher percentile rank means the tract faces more severe impacts relative to other tracts nationwide. (see data dictionary)
CDC
Domain: Health
Data Label: Total count of high prevalence sensitivity module indicators (out of six) in 2024
Data Definition: Total count of high prevalence sensitivity module indicators (out of six) in 2024. This variable was calculated as the sum of flagged indicators for sensitivity module. The Sensitivity module is comprised of pre-existing health conditions that may increase risk of negative health outcomes when the individual with the condition is exposed to extreme heat. The pre-existing health conditions in this module are:
- Asthma
- Chronic Obstructive Pulmonary Disease (COPD)
- Coronary Heart Disease (CHD)
- Diabetes
- Obesity
- Poor Mental Health.
While most indicators can have a range of values, the Sensitivity module indicators represent only whether a given ZCTA has a high estimated prevalence of the disease or not. High prevalence was determined when a ZCTA had a greater than 66th percentile rank of the pre-existing disease. The total count of these disease indictors ranges from 0-6, with a total of 6 indicating a higher risk of biological conditions that may increase negative health outcomes when exposed to extreme heat.
The HHI uses ZIP Code Tabulation Areas (ZCTAs) to aggregate data and show index ranks across the United States. Click a ZCTA on the map to see the indicators associated with this module. (see data dictionary)
CDC
Domain: Health
Data Label: Life expectancy at birth, as of 2010-2015
Data Definition: The average number of years a person born in this tract would be expected to live, as of 2010 to 2015. (see data dictionary)
Census
Domain: Access
Data Label: Estimated percent of Black or African American people without health insurance, between 2019-2023
Data Definition: Estimated percent of the Black or African American population without health insurance coverage, between 2019-2023. (see data dictionary)
HRSA
Domain: Access
Data Label: Medically Underserved Areas (MUA), as of 2024
Data Definition: Medically Underserved Areas (MUA), as of 2024. Medically Underserved Areas are designated by the Health Resources and Services Administration as having too few primary care providers, high infant mortality, high poverty, and/or a high elderly population. Medically Underserved Populations (MUP) are areas where a specific population group is underserved, including groups with economic, cultural, or linguistic barriers to primary medical care. If a population group does not meet the criteria for an MUP, but exceptional conditions exist which are a barrier to health services, they can be designated with a recommendation from the state’s Governor. (see data dictionary)
Feeding America
Domain: Access
Data Label: Percent of Black inhabitants (all ethnicities) who are food insecure in 2023
Data Definition: According to the United States Department of Agriculture (USDA), food insecurity is defined as the limited or uncertain availability of nutritionally adequate and safe foods, or the limited or uncertain ability to acquire acceptable foods in socially acceptable ways. Feeding America first analyzes the relationship between food insecurity and key indicators such as poverty, unemployment, homeownership, and disability prevalence at the state level. The resulting coefficients are then applied to the same variables at the county and congressional district levels to produce modeled local estimates of food insecurity for both individuals and children. These estimates are part of Feeding America’s annual Map the Meal Gap analysis. See the Data Directory for a link to the full methodology.
(see data dictionary)
Census
Domain: Access
Data Label: Estimated percent of households with no internet access, between 2019-2023
Data Definition: Estimated percent of households with no internet access, between 2019-2023. Internet access can include a subscription for dial-up, cellular, cable, fiber optic, DSL, satellite, or other service, or internet access without a subscription. Percentage calculations are suppressed in cases where the denominator of the calculation was less than 10 of the unit that is being described (e.g., households, people, householders, etc.). (see data dictionary)
Census
Domain: Access
Data Label: Estimated percent of housing units for which no vehicles are available in 2019-2023
Data Definition: Estimated percent of occupied housing units for which no vehicles are available in 2019-2023. Percentage calculations are suppressed in cases where the denominator of the calculation was less than 10 of the unit that is being described (e.g., households, people, householders, etc.). (see data dictionary)
Repair Data Indicators
Census
Domain: Housing segregation
Data Label: Estimated median value of an owner-occupied home, between 2019-2023
Data Definition: Estimated median value of an owner-occupied housing unit, between 2019-2023. The value is based on survey respondents’ estimates of how much their properties and lots would sell for if they were for sale. Medians were suppressed in cases where the sample of the average was less than 10 of the unit that is being described (e.g., households, people, householders, etc.). ACS employs values to indicate top and bottom ranges of values. A value of 1,000,001 indicates a value of 1,000,000 or greater, whereas a value of 9,999 indicates a value of 10,000 or less. (see data dictionary)
University of Richmond, University of Maryland, Virginia Tech, and Johns Hopkins University
Domain: Housing discrimination
Data Label: Grade assigned by the Home Owners Loan Corporation (HOLC) between 1935-1940
Data Definition: Grade assigned by the Home Owners Loan Corporation (HOLC) between 1935-1940. Area grades range from A to D, with A denoting ‘Excellent’, B denoting ‘Still Desirable’, C denoting ‘Definitely Declining’, D denoting ‘Hazardous’. Grades were assigned based on input from mortgage lenders, developers, and real estate appraisers, and were used to measure creditworthiness and risk on neighborhood and metropolitan levels. Mapping Inequality: Redlining in New Deal America, published by the Digital Scholarship Lab at University of Richmond in collaboration with University of Maryland, Virginia Tech, and Johns Hopkins University, includes a collection of digital maps on area security and descriptions for major urban centers developed by the Home Owners’ Loan Corporation (HOLC) from 1935 to 1940. (see data dictionary)
PolicyMap and FFIEC
Domain: Housing discrimination
Data Label: Percent of all home loans applied for by Black applicants that were denied in 2024
Data Definition: Percent of all home loans applied for by Black applicants that were denied in 2024.These denied loan applications were for the purchase or refinance of an owner-occupied, one-to-four family dwelling. Percents are not computed where the denominator of the calculation was less than five. (see data dictionary)
FDIC
Domain: Banking
Data Label: Percent of households with a Black householder that are unbanked as of 2019-2023
Data Definition: Percent of households with a Black householder that are unbanked as of 2019-2023. These households lack any kind of deposit account at an insured depository institution such as a bank or credit union. Data are not available where the sample size was too small to make an accurate estimate. These areas are labeled as “Insufficient Data” on the map. (see data dictionary)
United States Elections Project
Domain: Voter Turnout
Data Label: Turnout rate among voting eligible population in the 2020 presidential general election.
Data Definition: Turnout rate among voting eligible population in the 2020 presidential general election. Percent of voting eligible population who participated in the 2020 presidential general election. The turnout rate was calculated by dividing the number of votes for the highest office in the election (often president, governor, or congress) by the voting age population minus non-citizens and those in prison, on probation, or on parole, for states where such people are ineligible to vote. Some states permanently disenfranchise felons and people who have been judged mentally incompetent; these exclusions are not included in the data. Votes from people living overseas are counted in the vote total, but such people are not counted in the denominator, except at the national level. More information can be found at http://www.electproject.org/home/voter-turnout/faq. (see data dictionary)
Census, Opportunity Insights
Domain: Justice System
Data Label: Incarceration rate for Black people raised in very low income families as of 2018
Data Definition: Incarceration rate for Black people raised in very low income families as of 2018. This represents the percentage of people born between 1978 and 1983 who were raised in this area in households with incomes at or below the 25th percentile nationally who were incarcerated, according to the 2010 Census. The Opportunity Atlas was created by Opportunity Insights, a Harvard University-based research group, and researchers at the Census Bureau. The researchers linked responses from the U.S. Census with federal income tax data and American Community Survey responses to trace a person’s outcomes back to the place they were raised. (see data dictionary)
Demographic Data Indicators
Census
Domain: Race/Ethnicity
Data Label: Predominant racial or ethnic group, between 2019-2023
Data Definition: Predominant racial or ethnic group, by percentage of the population in the group. Data were obtained from the Census’ American Community Survey 2019-2023 estimates. This was calculated with non-overlapping racial and ethnic categories provided by the US Census Bureau, including the ethnic category Hispanic and the following 7 Non-Hispanic racial categories: White, African American, American Indian or Alaska native, Asian, Native Hawaiian or Pacific Islander, some other race, and two or more races. Geographies for which no data were provided or for which the population was less than 10 are represented as having “Insufficient Data.” (see data dictionary)
Census
Domain: Race/Ethnicity
Data Label: Estimated percent of all people who were Black or African American, between 2019-2023
Data Definition: Estimated percent of the population that is Black or African American, by single classification of Census race, between 2019-2023. Percentage calculations are suppressed in cases where the denominator of the calculation was less than 10 of the unit that is being described (e.g., households, people, householders, etc.). (see data dictionary)
Census
Domain: Income
Data Label: Estimated median income of a Black or African American householder, between 2019-2023
Data Definition: Estimated median income of a Black or African American householder, between 2019-2023. (see data dictionary)
Census
Domain: Educational attainment by race/ethnicity
Data Label: Estimated percent of Black or African American people with some high school, but no diploma, between 2019-2023
Data Definition: Estimated percent of the Black or African American population that is 25 years and older whose educational attainment is some high school but no diploma, between 2019-2023. Percentage calculations were suppressed in cases where the denominator of the calculation was less than 10 of the unit that is being described (e.g., households, people, householders, etc.). (see data dictionary)
Census
Domain: Educational attainment by race/ethnicity
Data Label: Estimated percent of Black or African American people with at least a high school diploma, between 2019-2023
Data Definition: Estimated percent of the Black or African American population that is 25 years and older with a high school diploma or greater level of education, between 2019-2023. Percentage calculations were suppressed in cases where the denominator of the calculation was less than 10 of the unit that is being described (e.g., households, people, householders, etc.). (see data dictionary)
Census
Domain: Educational attainment by race/ethnicity
Data Label: Estimated percent of Black or African American people with at least a Bachelor’s degree, between 2019-2023
Data Definition: Estimated percent of the Black or African American population that is 25 years and older with a Bachelor’s degree, graduate, or professional degree, between 2019-2023. Percentage calculations were suppressed in cases where the denominator of the calculation was less than 10 of the unit that is being described (e.g., households, people, householders, etc.). (see data dictionary)
Census
Domain: Poverty
Data Label: Estimated percent of all Black or African American people who lived in poverty, between 2019-2023
Data Definition: Estimated percent of all Black or African American people who lived in poverty, between 2019-2023. (see data dictionary)
One on One with E. Mackey of Blvck Spades

In 2023, Kindred Futures partnered with Village Micro Fund for the fall cohort of its Flourish Fellowship, in which entrepreneurs like Blvck Spades and Dope Heart Media Company founder E. Mackey gained practical skills while connecting to a legacy of Black economic thought and innovation. At the conclusion of the program, Kindred Futures awarded three entrepreneurs with $25,000 in grant capital.
Kindred collaborates with a diverse and growing network of grassroots, civic, academic, philanthropic, and private sector partners that help us deliver on our mission to build Black wealth and power including Business Support Organizations like Village Micro Fund.
For Mackey, a serial entrepreneur who believes in putting relationships over revenue, involvement in the cohort was a valuable steppingstone in continuing to build out his brand. “None of us has gotten to where we are alone,” he says. “And, in the context of the Black community, there is an understanding that if we don’t do it for ourselves, who else will? We also owe it to those who will follow to leave a legacy that they can build upon as well.”
 Kindred: You’ve been a content creator, videographer/photographer and now founder – what’s next?
EM: In addition to Blvck Spades, I own a creative agency called Dope Heart Media that provides photography, video production, graphic design, and more. Right now, my primary focus is on building a spades app, Blvcker, through Blvck Spades’ sister company, Blvck Haven Studio. We are currently in beta and hope to have the app officially launched by early to mid-October.
Kindred: What inspires you to keep pressing as you share your brand?
EM: My favorite word is posterity. So, I’m always thinking of what I can do to ensure that my life has a positive impact on future generations. I think that’s what motivates me most. I just want my existence to have made life better for people and to continue to do so long after I’m gone.
Kindred: You were a part of the Village Micro Fund cohort, which we have been a partner on. What are your thoughts on organizations like this supporting entrepreneurs?
EM: I think that organizations like Village Micro Fund, with the support of Kindred Futures, play a critical role in preparing small businesses for future growth. Speaking for myself, I was very confident in what I was building with Blvck Spades, and I had the core components in place. However, Village Micro Fund was vital in teaching me many of the things that I didn’t know that I didn’t know. I was in that cohort about 2 years ago, and what I learned there is at the core of many of the opportunities that I have had since. I can’t even communicate how beneficial that program was for me and my business(es).
A Call to Deepen Investment in Co-ops, Care, and Community-rooted Wealth

In August, Kindred Futures hosted Cooperative Development in the Care Economy – a convening focused on the care economy to delve into what it means to build shared ownership models grounded in care and community.
The session featured a panel including Esteban Kelly U.S. Federation of Worker Cooperatives Allison Curtis, with The ICA Group, and Teresa Mansell with Childspace Centers, who offered deep dives into the realities and promise of childcare cooperatives – not just theory, her origin story, strategy, and the work she has led for close to 40 years.
Also, during the half-day event, Kindred’s Research Manager Miriam Van Dyke, PhD, MPH, grounded attendees in the data landscape of early childhood in Georgia – showing clearly how consolidation, affordability crises, and workforce instability demand structural solutions.


Securing Georgia’s Future: References

- Median net worth estimates were derived from Esri’s 2023/2028 Updated Demographics dataset. See Esri, Methodology Statement: 2023/2028 Esri Updated Demographics (Redlands, CA: Esri, June 2023), https://www.esri.com/data/esri_data.
- Chetty, Raj, Nathaniel Hendren, Patrick Kline, and Emmanuel Saez. Where is the Land of Opportunity? The Geography of Intergenerational Mobility in the United States. Quarterly Journal of Economics 129, no. 4 (2014): 1553-1623. https://doi.org/10.1093/qje/qju022.
- Ibid.
- This report builds on findings from the Georgia Budget & Policy Institute, Baby Bonds in Georgia: Creating a Universal Savings and Investment Account Program for Children, which also outlines a universal savings program under House Bill 284. Both analyses find that such a policy could yield over $16,000 in wealth for eligible young adults by age 18, while helping close longstanding racial and regional gaps in economic opportunity.
- Kindred Futures analysis of a universal-progressive model.
- Ibid.
- Georgia General Assembly. 2025. House Bill 284, Georgia Baby Bond Savings Plan.
https://www.legis.ga.gov/bills/hb284. - Georgia General Assembly. 2025. House Resolution 99. Accessed March 9, 2025. https://www.legis.ga.gov/legislation/69674.
- Shapiro, Thomas M., and Edward N. Wolff, eds. Assets for the poor: The benefits of spreading asset ownership. Russell Sage Foundation, 2001.
- Kindred Futures analysis of Survey of Income and Program Participation (SIPP), 2023.
- Himmelstein, Kathryn E. W., Jourdyn A. Lawrence, Jaquelyn L. Jahn, Joniqua N. Ceasar, Michelle Morse, Mary T. Bassett, Bram Wispelwey et al., 2022. “Association between racial wealth inequities and racial disparities in longevity among us adults and role of reparations payments, 1992 to 2018”, Jama Network Open (11), 5:e2240519.
https://doi.org/10.1001/jamanetworkopen.2022.40519. - Kindred Futures analysis of Survey of Income and Program Participation (SIPP), 2025.
- Kindred Futures analysis of American Community Survey, 2023.
- 2024 kids count data book. (n.d.). The Annie E. Casey Foundation. Retrieved March 9, 2025, from
https://www.aecf.org/resources/2024-kids-count-data-book. - Darity, William, 2008. “Forty acres and a mule in the 21st century*”, Social Science Quarterly (3), 89:656-664.
https://doi.org/10.1111/j.1540-6237.2008.00555.x. - Kindred Futures analysis of Survey of Income and Program Participation (SIPP), 2023.
- Kindred Futures analysis of county-level net worth estimates provided by Esri, 2024.
- Derenoncourt, Ellora, Chi Hyun Kim, Moritz Kuhn, and Moritz Schularick. “The racial wealth gap, 1860-2020.” Manuscript, Princeton University and University of Bonn (2021).
- Cassidy, Christa, Rachel Heydemann, Anne Price, Nathaniel Unah, and William Darity Jr. “Baby bonds: A universal path to ensure the next generation has the capital to thrive.” Available from Samuel Dubois Cook Center on Social Equity at Duke University and the Insight Center for Community Economic Development website at https://insightcced. org/wp- content/uploads/2019/12/ICCED-Duke_BabyBonds_December2019-Linked. pdf (2019).
- Georgia General Assembly. 2025. House Resolution 99. Accessed March 9, 2025.
https://www.legis.ga.gov/legislation/69674. - U.S. Census Bureau, Survey of Income and Program Participation, Survey Year 2023, Public Use Data, Project No. P- 7516454, Dataset D-0000004561, Approval CBDRB-FY24-0222.
- Ibid.
- Darity, William, 2008. “Forty acres and a mule in the 21st century*”, Social Science Quarterly (3), 89:656-664. https://doi.org/10.1111/j.1540-6237.2008.00555.x; Collins, William and Robert A. Margo, 2011. “Race and home ownership from the end of the civil war to the present”, American Economic Review (3), 101:355-359.
https://doi.org/10.1257/aer.101.3.355. - Vekemans, Marie-Cécile, Gianna Short, Charles B. Dodson, and Bruce L. Ahrendsen. “Loan survival: Are Black farmers more likely to default?.” Applied Economic Perspectives and Policy 46, no. 1 (2024): 137-153.
- Signe-Mary McKernan and others, “Private Transfers, Race, and Wealth” (Washington: Urban Institute, 2011), available at https://www.urban.org/sites/default/files/alfresco/publication-pdfs/412371-Private-Transfers-Race-and-.
- Kindred Futures analysis of county-level net worth estimates, Esri, 2024.
- Ibid.
- Sherman, Jennifer. Dividing paradise: Rural inequality and the diminishing American dream. Univ of California Press, 2021.
- U.S. Census Bureau, Survey of Income and Program Participation, Survey Year 2023, Public Use Data, Project No. P- 7516454, Dataset D-0000004561, Approval CBDRB-FY24-0222.
- Ibid.
- Jones, John Bailey, and Urvi Neelakantan. “Portfolios Across the US Wealth Distribution.” Richmond Fed Economic Brief 23, no. 39 (2023).
- Kindred Futures analysis of data from the Opportunity Atlas, county-level estimates of average income among the 1992 birth cohort.
- Chetty, Raj, Will S. Dobbie, Benjamin Goldman, Sonya Porter, and Crystal Yang. Changing opportunity: Sociological mechanisms underlying growing class gaps and shrinking race gaps in economic mobility. No. w32697. National Bureau of Economic Research, 2024.
- Fry, R. (2014, May 14). Young adults, student debt and economic well-being. Pew Research Center. https://www.pewresearch.org/social-trends/2014/05/14/young-adults-student-debt-and-economic-well-being/.
- Kindred Futures analysis of data provided by the Georgia Department of Public Health, 2024.
- Medicaid coverage by race/ethnicity: Georgia, 2021-2023 average. (n.d.). March of Dimes | PeriStats. Retrieved March 9, 2025, from
https://www.marchofdimes.org/peristats/data?reg=99&top=11&stop=653&lev=1&slev=4&obj=1&sreg=13. - Cramer, Reid, and David Newville. Children’s Savings Accounts: The Case for Creating a Lifelong Savings Platform at Birth as a Foundation for a “Save-and-Invest” Economy (Washington, DC: New America Foundation, 2009).
- Kindred Futures analysis of a universal-progressive model.
- Ibid.
- Raising capital for startups: 8 statistics that will surprise you – fundera ledger. (n.d.). Retrieved March 9, 2025, from https://www.fundera.com/resources/startup-funding-statistics.
- Zewde, Naomi. 2020. “Universal Baby Bonds Reduce Black-White Wealth Inequality, Progressively Raise Net Worth of All Young Adults.” Review of Black Political Economy 47 (1): 3-19.
https://doi.org/10.1177/0034644619885321. - Jones-Layman, Amanda. “Educationalizing Assets: Framing Children’s Savings Accounts as an Educational Solution.” PhD diss., University of Pennsylvania, 2021.
- Save for college. (2024, September 9). Office of Financial Empowerment.
http://sfgov.org/ofe/save-college. - Huang, Jin, Michael Sherraden, and Jason Q. Purnell. “Impacts of Child Development Accounts on maternal depressive symptoms: Evidence from a randomized statewide policy experiment.” Social Science & Medicine 112 (2014): 30-38.
- Connecticut baby bonds. (n.d.). CT.Gov – Connecticut’s Official State Website. Retrieved March 9, 2025, from
https://portal.ct.gov/ott/debt-management/ct-baby-bonds. - Cosic, Damir, Madeline Brown, Amalie Zinn, Sonia Torres Rodríguez, and Ofronama Biu. Modeling the Impact of a Federal Baby Bonds Program: Impacts on Financial Wealth, College Attainment, Student Debt, Home Equity, and Retirement Savings. Urban Institute, 2024.
- Georgia General Assembly. House Bill 284, Georgia Baby Bond Savings Plan. 2025.
https://www.legis.ga.gov/bills/hb284. - To calculate the total wealth increase for one birth cohort under HB 284, we first estimate the annual state investment per child (initial deposit + recurring contributions) and project its growth using a 5% annual return. We categorize recipients into two groups: standard recipients receiving $250 at birth and annually, and low-income recipients receiving $1,000 at birth and $500 annually. Using Georgia’s estimated 125,951 births per year (with 55% qualifying for the higher-tier contributions), we apply compound interest formulas to project individual account balances at age 18 ($7,000 for standard recipients, roughly $15,000 for low-income recipients). Multiplying by the number of children in each category gives the total projected wealth for the cohort, which amounts to $1.44 billion in accumulated assets by adulthood.
- How does a 529 plan work in Georgia? (n.d.). Retrieved March 9, 2025, from
https://www.path2college529.com/learn/how-does-a-529-plan-work/.
Read More Of The Report


Securing Georgia’s Future: Implementation Steps and Conclusion

Implementation Steps and Conclusion
Implementation Steps
To implement a baby bonds program in Georgia, several practical steps need consideration. First, the state would need to establish a Georgia Baby Bonds Trust Fund through legislation that defines the program’s parameters (eligibility, contribution schedule, allowable uses of funds, and administrative authority). HB 284 and HR 99 already lay the groundwork, proposing a constitutional trust fund to protect the funds. The program could be administered by a state agency like the Office of the State Treasurer to manage the investments.
One advantage is that verifying eligibility is straightforward if tied to existing programs like Medicaid or other safety net programs administered by the Georgia Department of Human Services. The state can automatically enroll every Medicaid-born child, and if universal base deposits are included, every birth can be registered via birth certificate records. The funds would be invested likely in a diversified portfolio (much like the state’s pension fund or 529 college savings plan49 ) to earn returns above inflation. Over 18 years or more, even conservative investments could roughly double the initial principal (as assumed 5 percent growth in our estimates).
Conclusion
Georgia stands at a crossroads: we can either accept the status quo of widening wealth inequality – with all the social and economic costs it entails – or we can boldly invest in a future of broadly shared prosperity. Baby Bonds offer a practical, forward-looking strategy to do the latter. By investing modestly now in every Georgia child’s future, we reap a more secure and thriving state later. The economic case is compelling. Closing the racial and rural-urban wealth divide would boost Georgia’s GDP and expand the state’s tax base. Wealth inequality is a policy choice. It has been created (or at least permitted) by collective policy decisions over time. Georgia can choose a different path by enacting baby bonds, signaling that we value every child’s potential.
In crafting baby bonds legislation, Georgia’s leaders should ensure the program is universal, inclusive, and adequately funded to make a difference. The recommendation of this report is to implement a universal-with-progressivity baby bonds program: provide a base trust for all newborns and larger contributions for those from low-wealth families. This design maximizes political viability and equity. Funding should be secured through a sustainable mechanism – for example, dedicate a fraction of annual surplus revenues or close a special interest tax loophole to fund the trust. Over time, as the program proves its worth, it could be expanded or adjusted, and perhaps federal support might augment it if a national program comes to fruition.
A statewide baby bonds policy is an investment in our collective future that we cannot afford to pass up. The time to act is now, so that every child born tomorrow in the Peach State will one day take part in Georgia’s prosperity as an owner, investor, or entrepreneur.

Georgia is poised to be a leader in state-level Baby Bonds policy

Georgia is poised to be a leader
in state-level Baby Bonds policy

Building on proposed legislation (2025 House Bill 284 and HR 99, 202547 ), this section outlines how a Georgia Baby Bonds program could work, compares design options, and evaluates their costs and benefits. The overarching goal is to maximize the program’s impact on narrowing the racial wealth gap and uplifting low-wealth communities, while ensuring financial and political feasibility.
The core of baby bonds is simple: the state would deposit a sum of money into a trust fund for each eligible newborn, invest those funds until the child reaches adulthood, then allow the young adult to withdraw the money for approved uses. Within this policy, however, there are key design choices. Options range from a one-time deposit at birth to ongoing contributions throughout childhood. This report compares three models:
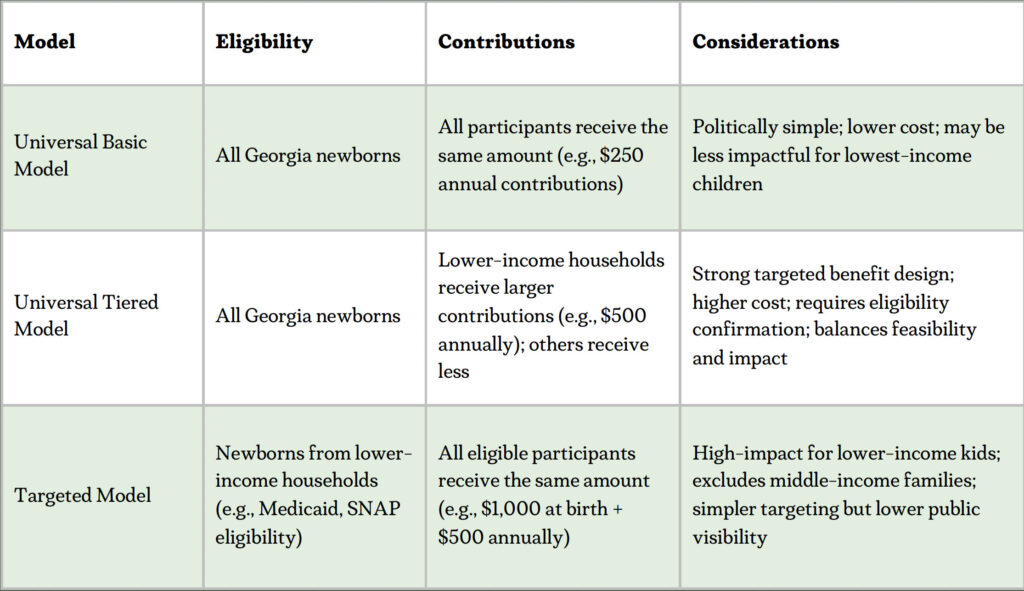
In evaluating the available baby bonds models for Georgia, we recommend a hybrid approach that combines universal eligibility with income-based tiered contributions, as proposed in GA House Bill 284.
This design achieves multiple policy objectives: it ensures near-universal participation, simplifies enrollment through automatic birth registration, and allocates greater resources to children most likely to face long-term asset deprivation. Georgia’s demographic and economic context justifies this approach. A majority of rural births are Medicaid-covered, indicating disproportionate exposure to intergenerational wealth constraints. A flat universal model may be administratively efficient but lacks the targeting necessary to meaningfully reduce disparities. Conversely, a strictly targeted model could undermine public buy-in and limit political feasibility by excluding moderate-income families who also lack asset-building tools.
By contrast, a universal tiered model maximizes efficiency. It directs higher-value contributions to the bottom of the wealth distribution, where public dollars have the greatest marginal impact, while maintaining broad political appeal through universal access. This approach aligns with research indicating that targeted asset investments in early life yield high long-term returns in education, employment, and tax contributions, and reduces downstream public costs related to housing instability, underemployment, and debt.
Designing an effective baby bonds program for Georgia requires careful attention to core implementation principles that ensure access, growth, and long-term impact. Below are five key principles that should guide program development:
-
Automatic Enrollment & Universal Access. Every child born in Georgia should be automatically enrolled in the baby bonds program at birth, ensuring that all eligible children—regardless of parental income, financial education, or bureaucratic barriers—receive a starting asset. By making the program universal and automatic, Georgia eliminates disparities in access and ensures that every child has a foundation for wealth-building.
-
Publicly Managed Trust with Guaranteed Growth. The state should invest baby bond funds in a public trust, managed to achieve stable, long-term growth with a minimum guaranteed return (e.g., 3-5 percent annually). Using a diversified investment strategy—similar to pension funds or sovereign wealth funds—the program ensures that each account grows over time. This structure allows the state to maximize wealth-building opportunities while maintaining responsible oversight and financial sustainability.
-
Guided Use with Flexible Guardrails at Withdrawal Age. Upon reaching eligibility at age 18 or higher, recipients should have broad flexibility in how they use their funds for wealth-building purposes such as education, homeownership, entrepreneurship, or relocation for employment. To balance agency with public accountability, the program could offer financial advising or planning resources to help participants make informed decisions and maximize long-term impact. These light-touch guardrails would build confidence in the program while preserving recipients’ ability to shape their economic futures.
-
Tiered Contribution Model for Targeted Impact. To address Georgia’s racial and rural-urban wealth divide, the program should use a tiered funding structure, providing larger contributions to children from lower-income households. While all children would receive a base deposit, additional contributions would be scaled by family income, ensuring that those with fewer financial resources receive the most significant support.
-
Statewide Wealth-Building & Economic Development Integration. Baby bonds should be integrated into Georgia’s broader strategy for inclusive economic growth. This includes aligning the program with existing wealth-building policies—such as first-time homebuyer incentives, small business capital access, and rural revitalization efforts and leveraging partnerships to provide financial education and outreach in disinvested communities.
A scalable baby bonds policy with automatic enrollment and tiered contributions would support a modest yet high-return investment in the next generation’s economic future.
Notably, there are ways to mitigate the budgetary impact for the state: for example, establishing an endowment or trust fund today that grows and pays out benefits 18 years later, or using state bond financing (spread over decades) to fund the accounts upfront. The return on investment (ROI) for Georgia’s economy could be substantial. If tens of thousands of young Georgians each year enter adulthood with assets, we can expect higher college completion rates, greater entrepreneurship, and increased homeownership. Under House Bill 284, Georgia’s youth and young adults can acquire an estimated $1.4 billion in wealth per birth cohort to invest in Georgia’s economy when they reach the age of 18.48
The map illustrates the projected per capita wealth gains for newborns in Georgia under House Bill 284, showing how Baby Bonds have the greatest relative impact in rural counties. While absolute wealth accumulation is higher in Metro Atlanta due to larger populations, this per capita analysis highlights where each child stands to benefit the most. The darker-shaded counties, concentrated in South and Central Georgia, reflect areas where a higher proportion of newborns qualify for the larger $15,000 baby bonds contribution, leading to greater wealth-building potential. In contrast, lighter-shaded counties, primarily in affluent suburban and metro areas, have lower per-child wealth gains due to a smaller share of low-income births. This visualization reinforces how baby bonds can help close wealth disparities between rural and urban communities, ensuring that children born in Georgia’s lowest-income counties have: stronger financial foundation by adulthood.
Under House Bill 284, Georgia’s youth and young adults can acquire an estimated $1.4 billion in wealth per birth cohort to invest in Georgia’s economy when they reach the age of 18.
Why Baby Bonds?


Mounting evidence shows that assets can matter as much as income for a family’s long-term success.37 Income pays the bills, but assets change the future. A family with a savings cushion can move to pursue a better job, invest in a child’s education, or absorb a medical bill without plunging into poverty. Conversely, families without assets are one emergency away from hardship and have difficulty planning beyond immediate needs.
Assets like savings accounts, home equity, or thriving business ownership correlate with long-term financial stability and positive life outcomes. Families with even modest levels of wealth are better positioned to invest in education, weather financial shocks, and plan for the future. Yet millions of children grow up without any financial cushion to support their transition into adulthood. While income is essential, it often isn’t enough to break the cycle of generational poverty if families cannot accumulate some wealth. That’s why baby bonds focus on seeding assets—not just income supplements to the next generation, enabling young people to start adulthood with a meaningful foundation for economic security.
Baby bonds would inject new wealth into Georgia’s communities, allowing young adults to invest in education, homeownership, and entrepreneurship. Each year, a new cohort of 18-year-olds could collectively gain more than a billion dollars in total wealth38, stimulating local economies. This influx of capital could reduce student debt, increase homeownership rates, support small business formation, and enhance financial stability across the state. The debt-reducing power of baby bonds improves long-term economic security and increases disposable income, benefiting both individuals and local businesses, people and the economy.
Homeownership, Entrepreneurship, Asset Building
A baby bond account with just $10,000-$15,00039 by adulthood could serve as a down payment on a starter home in many parts of Georgia. Early homeownership helps young families build equity, which is a primary driver of intergenerational wealth. Baby bond recipients would own homes sooner and accumulate more equity by mid-life, strengthening communities through greater housing stability and increased property values. Additionally, increased homeownership leads to higher rates of civic engagement and neighborhood investment.
Supporting Entrepreneurship and Small Business Growth
Lack of startup capital is a major barrier for young entrepreneurs. With baby bonds, many Georgians could access the capital typically needed to start a business, fueling small business creation in historically across the state. Since 77 percent of small businesses rely on personal savings to launch, baby bonds could enable more increased diverse business ownership and job creation.40 Whether recipients use funds to open a storefront business or invest in digital entrepreneurship, baby bonds provide the necessary seed capital to turn business ideas into reality.
Local Economic Stimulus and Community Revitalization
Adults with baby bonds would spend and invest in their local economies, purchasing goods, securing housing, and starting businesses. This targeted wealth infusion could revitalize neighborhoods that suffered from disinvestment, particularly in historically Black and rural communities. Areas with historically limited financial resources would see increased consumer spending, better credit access, and overall economic improvement. Additionally, recipients using funds for wealth-building activities—like education, homeownership, or business investment—would experience higher incomes and net worth over time, further contributing to economic growth and stability in Georgia.
Fueling Long-Term Economic Growth
A wealth-building policy like baby bonds benefits the broader economy by expanding ownership, increasing consumer spending, and encouraging investment. When young people have capital, they are more likely to stay in their communities. Simulations suggest that Baby Bonds could reduce wealth concentration at the top while strengthening the middle class.41 Every Georgian would benefit from higher earnings, increased tax revenues, and a more dynamic economy.
Evidence from Other Initiatives
Baby bond policy is not an entirely new concept, but it builds on real-world experiments with Children’s Savings Accounts (CSAs), trust fund programs, and individual development accounts (IDAs).42 The idea of an endowment at birth has been tested. In the United States, many states and cities have launched CSAs, typically aimed at college savings. For instance, San Francisco’s Kindergarten to College program automatically opens a savings account with $50 for every public kindergarten student.43 Similarly, Maine’s Alfond Scholarship and programs in states like Oklahoma and Pennsylvania provide small deposits for children at birth or school entry.
These CSA programs, while modest in dollar amounts, have demonstrated important lessons: automatic enrollment leads to near-universal participation, and even minimal seed deposits spur families to contribute and engage in financial planning for their children.44 In Oklahoma’s SEED for Oklahoma Kids (a randomized control trial), every child in the treatment group received $1,000 in a 529 college account at birth. By toddlerhood, virtually 100 percent of those children had an account (compared to just 3 percent of the control group), and their average college savings (including the seed money) was about $1,040 versus only $13 for kids that were not enrolled. This shows the power of making saving automatic and funded – it creates a future asset that families would otherwise never have.
Baby bonds take these concepts further by providing larger dollar amounts and expanding the use of savings for wealth-building purposes in young adulthood. Several jurisdictions have moved to enact or explore baby bonds policies:
- Connecticut became the first state to pass baby bonds into law in 2021, with plans to invest $3,200 at birth for every baby born on Medicaid (approximately 15,000 babies a year). Connecticut’s program, once funded, is expected to yield around $10,000-$11,000 per beneficiary by maturity at age 18 for approved uses (education, homeownership, business, or retirement).45
- At least nine states have considered baby bonds legislation in recent years, often with bipartisan interest. This momentum is fueled by simulation research indicating strong potential impacts.
- A national baby bonds program (with sliding-scale contributions up to $50,000 for the lowest-wealth families) would virtually eliminate the racial wealth divide among young adults. Specifically, the median wealth divide between White and Black young households could shrink by over 90 percent, from a $43,100 divide to about $21,300. At the same time, baby bonds would raise the net worth of all young adults in the bottom 90 percent of the country’s wealth distribution. In other words, baby bonds can boost those who have least without harming the broader economy; in fact, they infuse new capital into communities that need it most, likely yielding positive economic spillovers.46
For Georgia, baby bonds offer a policy tailored to our state’s efforts to uplift rural and low-wealth communities.
Consider some of Georgia’s unique wealth challenges: wide gaps between booming counties and struggling ones across the state. Traditional economic development hasn’t solved these problems – for instance, job growth in Atlanta doesn’t automatically translate to wealth for a family in Albany or a renter in Savannah. Every child born into a poor family in Georgia would, by design, accumulate a substantial financial asset by adulthood through baby bonds. This is essentially a publicly funded trust fund for the least advantaged, something that wealthy families routinely provide to their heirs, but low-wealth families cannot.
Importantly, Baby Bonds would help bridge Georgia’s racial wealth divide while also benefiting low-wealth people of all races. For example, many low-income White families in rural Georgia would receive the same asset boost for their children as low-income Black families in Atlanta’s Westside. Likewise, bringing rural areas into the economic mainstream would expand Georgia’s tax base and labor force. Baby bonds guarantee that every child has a fair start, thereby fostering a future where success is determined more by talent and effort and less by parental wealth.
Current Wealth-Building Realities for Georgia’s Youth and Young Adults

Current Wealth-Building Realities
for Georgia's Youth and Young Adults
Upward Mobility for Children Born in the
Bottom of the Income Ladder in Georgia
Economic mobility in Georgia remains significantly limited, particularly for children born into low-income households. A child born in Georgia to parents in the bottom 20 percent of the income ladder has less than a 5 percent chance of reaching the top 20 percent as an adult.32 To make matters worse, very few will surpass the poverty line later in life. Only children born in five counties will rise above the poverty line, and just barely. Structural barriers including disparities in wealth inheritance and economic investment, create significant challenges for children in Georgia to move up the economic ladder. Without intervention, these trends contribute to persistent wealth divides and hinder long-term economic growth across the state.
Geographically, mobility outcomes are particularly poor for children raised in certain regions of Georgia, including rural communities and historically disinvested neighborhoods across the state. Low-mobility zones tend to have higher poverty rates, lower-performing schools, and fewer job opportunities—factors that limit wealth accumulation as children transition into adulthood. The fact that economic mobility is so constrained in Georgia underscores the importance of policies that provide financial resources to children from an early age.33
Median Net Worth of Young Adults
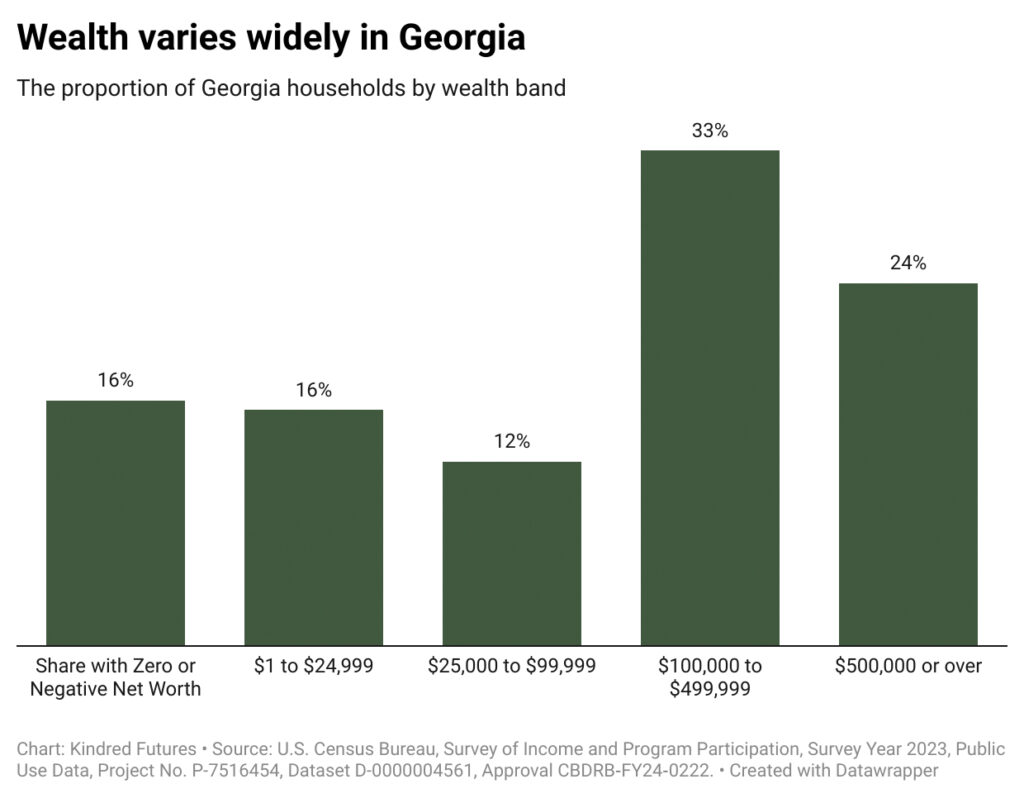
For young adults in Georgia, the ability to build wealth early in life is crucial for long-term economic stability. However, median net worth data show that many young adults—especially those from low-wealth, rural and Black or Latinx families—enter adulthood with little to no financial assets. Nationally, young adults start out with a median net worth that often falls below $10,000. In Georgia, disparities in early-life financial resources mean that many young adults start their careers with zero or even negative net worth, particularly if they have accumulated student loan debt or face difficulties securing stable, well-paying jobs.34
The lack of early wealth presents a major hurdle to economic mobility, as young adults with few financial assets struggle to afford higher education, buy a home, or start a business—three of the most common pathways to long-term wealth accumulation. By providing a capital endowment at birth, baby bonds would ensure that every young adult in Georgia has a financial resource to help them transition successfully into independent adulthood.
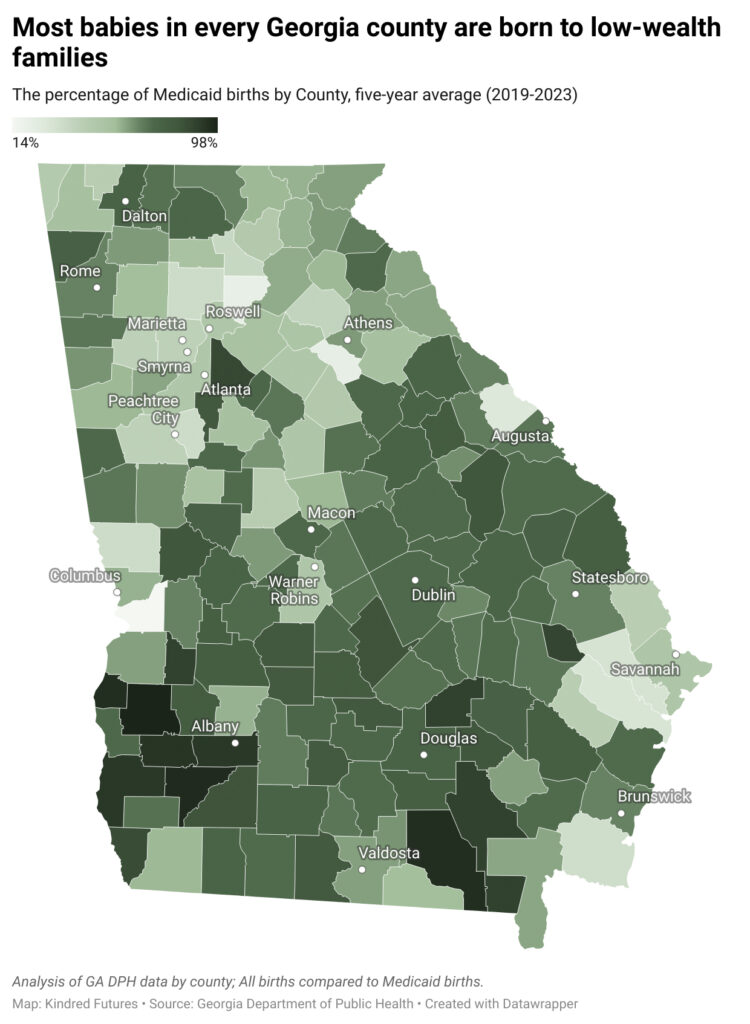
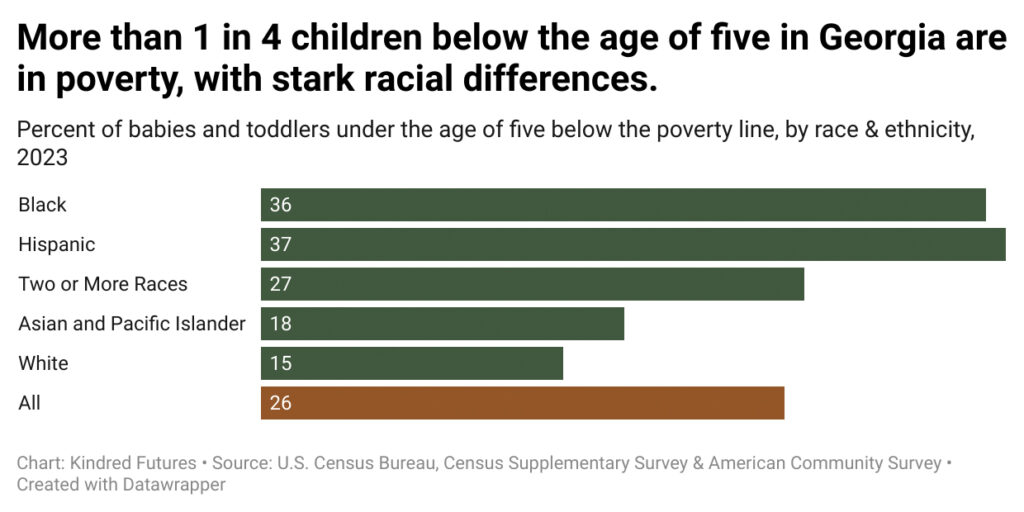
Percentage of Babies Born to low-wealth households
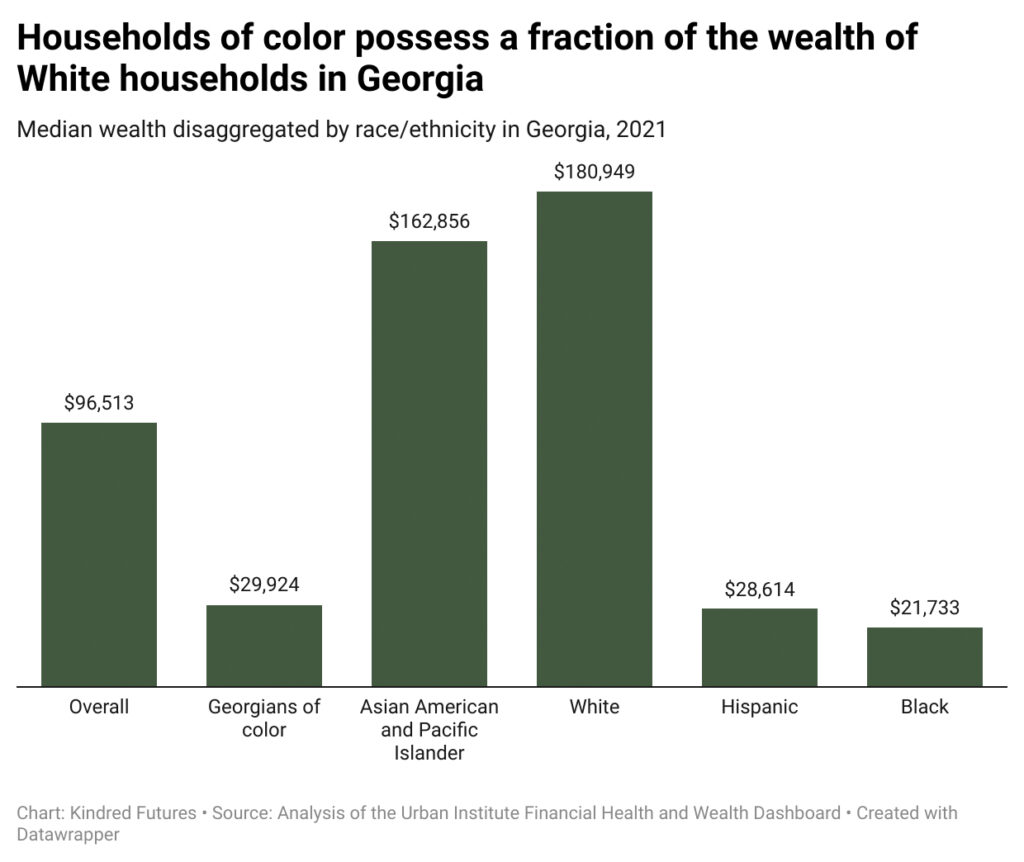
A significant portion of Georgia’s newborns enter a landscape shaped by structural economic inequality.35 Nearly half of all births in the state are covered by Medicaid, reflecting broader patterns of limited access to generational wealth, quality employment, and affordable healthcare. These inequities are not evenly distributed: Black and Latino infants are far more likely to be born into households classified as low-wealth due to historic and ongoing exclusion from economic opportunity. According to the Georgia Department of Public Health, nearly 65 percent of Black babies are born into Medicaid-eligible families, compared to about 35 percent of white newborns—underscoring how racial disparities in wealth and public health are present from birth.36
These disparities in birth conditions set the stage for long-term economic inequalities. Babies born into poverty often experience financial instability in their households, which can impact early childhood development, educational attainment, and future wealth-building opportunities.
Without targeted interventions, children born into lower-wealth families are more likely to remain economically disadvantaged as adults, reinforcing generational cycles of wealth inequality. Strong policies are needed to offset the financial disadvantages present from birth, ensuring that all children—regardless of the household they are born into—have a fair opportunity to build wealth and achieve long-term economic security.
Georgia’s Urban-rural Wealth Divide

Georgia's Urban-rural Wealth Divide

Georgia’s urban-rural wealth divide also deserves attention. Despite the vast majority of the state being rural, approximately 17 percent of the state’s household wealth is held in rural counties while 83 percent of the wealth is in non-rural counties.26 In North Georgia’s Forsyth, Cherokee, and Fayette counties (suburban areas near Atlanta), median household net worth exceeds $700,000. By contrast, many rural counties in east and South Georgia show median net worth figures below $100,000. For instance, in Chattahoochee County (south-western Georgia), the median household has around $15,000 in wealth.27
These differences reflect structural factors: rural economies often rely on a few industries (such as agriculture or manufacturing) and have seen the outmigration of talent and capital over the years.28 When a factory closes or crop prices fall, local wealth doesn’t have a cushion and can evaporate quickly, forcing families to deplete savings or go into debt. Additionally, assets common in rural areas (like small homes or used vehicles) do not appreciate in value as much as assets like urban real estate or stocks. All of this means that a child born in a low-wealth rural Georgia county faces an uphill climb to accumulate wealth in adulthood, even if their income improves.
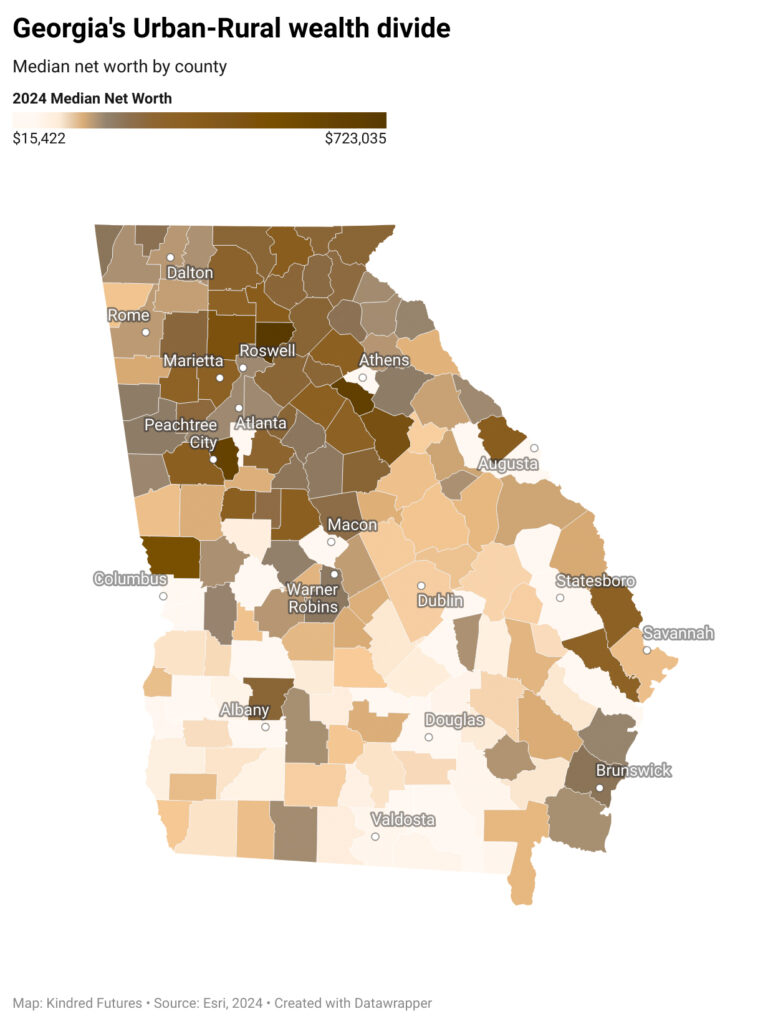
It is precisely these disparities that baby bonds are designed to counteract. By seeding wealth for those who have very little or none at all, baby bonds could gradually even out the disparities and create a more balanced economic landscape in Georgia.
Asset Types Highlight Need for Broad Investment Tools for Georgians

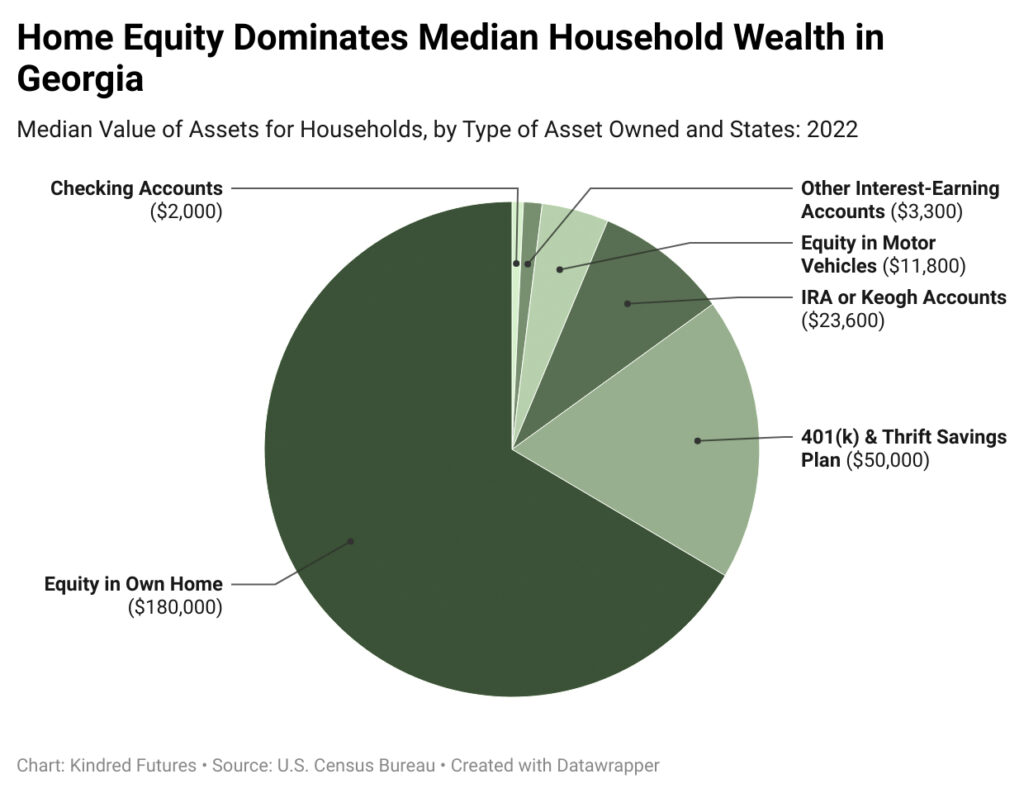
Home equity is the single largest component of household wealth in Georgia, exceeding even retirement savings and investment accounts. While it is expected to surpass lower-value assets like checking accounts or vehicles, the fact that it also outpaces higher-value, growth-oriented assets highlights how central homeownership is to wealth-building in the state. For families unable to afford a down payment or access credit, this creates a significant barrier to accumulating long-term wealth.29 The fact that the biggest share of median household wealth comes from owning a home underscore how critical an initial wealth starter can be.
Families from low-wealth backgrounds face multiple barriers to building home equity. First, many cannot afford the upfront costs of homeownership—especially the down payment—because they lack savings or family wealth transfers. This prevents them from accessing the primary pathway to long-term wealth accumulation in Georgia. Second, even those who do purchase homes often do so with smaller down payments, resulting in slower equity growth and greater vulnerability to market fluctuations. These structural disadvantages compound over time, making it harder to catch up with peers who entered the housing market with more capital, like retirement accounts or investment accounts.
There are also notable differences in how White and Black households in Georgia allocate their wealth across various asset categories. For White households, retirement accounts and primary residences each represent over a quarter of total holdings, with smaller yet meaningful shares in businesses, stocks, and mutual funds. In contrast, Black households direct nearly half of their asset portfolio toward business ownership, while retirement accounts and stocks make up relatively smaller proportions.30 This contrast points to distinct paths of wealth-building between the two groups, with White families more heavily invested in employer-sponsored or market-based vehicles (like 401(k)s and mutual funds), whereas Black families appear to rely more on entrepreneurial ventures and real estate for asset growth.
Households with a higher reliance on business ownership or real estate, for example, may face greater risks if they lack startup capital or resources to buffer against market swings.31 The variation in asset-holdings and values underscores why a universal policy that builds assets early on—rather than relying solely on traditional savings mechanisms—could be especially powerful in leveling the playing field for families who otherwise struggle to access stable, growth-oriented investments.
Current State of Wealth for Georgians

Current State of Wealth for Georgians
Executive Summary

By many measures, Georgia’s economy is dynamic — yet the benefits are unevenly distributed. The median net worth of Georgia households is $166,300, ranking 26th out of the 45 states that have sufficient-enough data to report household wealth estimates.21 However, this single figure masks huge variations. For instance, 16 percent of Georgia households have zero or negative net worth, which means they have no resources to fall back on in the event of a financial emergency.
There is also geographic and racial inequality within Georgia – an inequality that is even more pronounced when looking at wealth. Statewide, White families are far more likely to own homes, businesses, and retirement accounts, whereas Black and Latinx families are overrepresented among the asset-poor, which contributes to a widening racial wealth divide.22 This means many families of color in Georgia have little beyond paycheck-to-paycheck income – few reserves to draw on for college tuition, a down payment, or an emergency expense.
Racial wealth inequality in Georgia has historical roots. Decades of discriminatory policies denied Black Georgians the chance to build wealth on equal terms.23 Similarly, rural Black communities suffered from Jim Crow-era exclusion and continue to experience depressed property values and limited access to credit.24 On the other side of the ledger, many White families – even of modest means – have benefited from intergenerational transfers of wealth. Large gifts and inheritances account for about 12 percent of the White-Black wealth divide nationally.25