Securing Georgia’s Future: Executive Summary and Introduction

Executive Summary

Georgia’s economy is growing, but prosperity remains out of reach for many families. In Forsyth County, just north of Atlanta, the median household net worth exceeds $720,000. In nearby rural Chattahoochee County, it’s closer to $15,000.1

These vast disparities—by geography, race, and wealth—are not anomalies; they are the result of generations of unequal access to asset-building opportunities. For families without wealth, even a small financial emergency can derail progress toward homeownership, education, or small business formation. As a result, Georgia’s persistent wealth divide continues to constrain economic mobility and limit the state’s full potential.

These wealth disparities don’t just reflect the past – they shape the future, limiting the ability of children born into low-wealth households to move up the economic ladder. Georgia — like much of the Southeast — has among the lowest rates of intergenerational economic mobility in the United States2. In most parts of Georgia, a child born to parents in the bottom 20 percent of the income distribution has less than a five percent chance of rising to the middle class, reflecting persistent and intergenerational cycles of poverty.3

This report makes the economic case for children’s trust accounts, or baby bonds, as a state policy to address Georgia’s growing wealth inequality4. Baby bonds – publicly funded trust accounts for children would provide Georgia newborns vulnerable to poverty with a safety net for their future, giving young adults capital needed to go to college, help purchase a home, start a business, or reinvest into Georgia’s economy in other meaningful ways. By design, baby bonds would invest more in children from lower-wealth families, helping to close the wealth divide while benefiting all communities across Georgia.5

Key Findings

  • A universal baby bonds program in Georgia could build $1.4 billion in new wealth per birth cohort.6
  • Eligible children could access up to $16,000 by age 18 under the proposed model.
  • Rural counties—especially in South and Central Georgia—would benefit most due to higher rates of low-wealth births.
  • Baby bonds would advance economic mobility, reduce future public assistance needs, and help close Georgia’s racial wealth divide.

Recommendation

Georgia should implement a baby bonds program with universal eligibility and tiered contributions, as proposed in House Bill 2847 and House Resolution 998 (2025). Under this model, eligible newborns would receive a starter deposit and children in lower-wealth families (e.g. those on Medicaid) would receive substantially larger deposits or annual top-ups. By age 18, eligible youth could accumulate up to $16,000 in a trust account, depending on investment growth. 

This report assesses the state of wealth in Georgia currently, evaluates the cost and impact of several funding scenarios – from a basic universal plan to a more generous targeted plan – and finds that the progressive model would deliver the greatest reduction in Georgia’s wealth divide while remaining financially feasible and making an investment that would yield high returns in the form of a more prosperous generation of Georgians.

Introduction

Wealth—traditionally defined as the assets a family owns minus their debts—is a bedrock of financial security and opportunity.9 Yet wealth is distributed very unevenly in Georgia, leading to stark differences in life outcomes.10 While income allows families to get by month-to-month, wealth provides the resilience and springboard for families to get ahead. 

A nest egg can finance a down payment on a home, seed a business venture, or put a young adult through college – investments that build prosperity across generations. Unfortunately, many Georgia families have been historically excluded from wealth-building, whether due to low incomes, lack of inheritance, or discriminatory policies11. As a result, our state today grapples with deep wealth and income inequality along racial and geographic lines.12 Addressing this inequality isn’t just a moral imperative – it is essential for Georgia’s long-term economic health.

Georgia’s context highlights why a bold policy like baby bonds is worth considering. The state’s population of 10.7 million is diverse and growing. Atlanta’s booming metro area fosters substantial wealth creation, yet many rural communities have abundant strengths that remain underinvested, limiting their asset-building opportunities. Nearly 15 percent of Georgians live in poverty (and poverty rates in some rural counties exceed 30 percent).13 Moreover, Georgia ranks 37th in the nation for child well-being, partly due to high rates of child poverty and limited family assets. 14

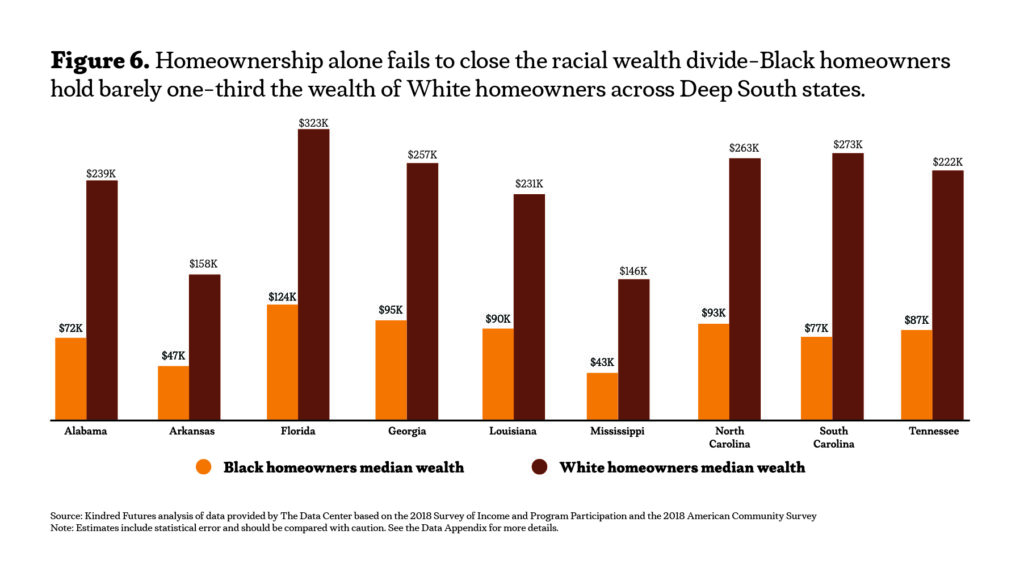
Crucially, wealth inequality in Georgia falls along historic racial lines.¹⁵ Generations of Black families were prevented from accumulating assets – first through slavery and sharecropping, penal colonies, later via Jim Crow segregation, redlining in housing, and exclusion from financial markets.15 These public policies created a yawning racial wealth divide that persists today: Georgia’s typical White family has about $180,949 in wealth versus just $21,733 for the typical Black family.16

At the same time, wealth inequality in Georgia is not solely an urban or racial issue – it has a clear geographic dimension. Three in four of Georgia’s 159 counties are rural, and many have not shared equally in the state’s economic growth. Approximately 17 percent of the state’s wealth is held in rural counties despite the vast majority of the state being rural, while 83 percent of the wealth is in non-rural counties. For example, in affluent Forsyth County north of Atlanta, the median net worth is over $720,000, while in rural Chattahoochee County it’s around $15,000.17

Such extreme differences reflect the concentration of high-paying jobs and real estate values in metro areas versus the chronic underinvestment in rural South Georgia. The result is a patchwork economy: some Georgia families enjoy stability and plenty, while many others whether in Atlanta’s Southside or Appalachia’s hill country — have little or no wealth to fall back on. Since policy choices created many of these disparities,18 smart and bold policy choices can help reduce them.

Faced with these challenges, state leaders have begun exploring solutions to boost household wealth and reduce inequalities. Traditional approaches have included spurring job creation, improving education, and offering tax credits for working families. While important, these measures alone haven’t closed the wealth divide, in part because they do not directly provide assets to those starting with very little or none. 

This is where baby bonds enter the discussion. Baby bonds propose to endow every child with a small trust fund at birth, which the child can claim upon reaching adulthood for wealth-building uses.19 By giving children — especially those from low-wealth families — a lump sum of capital as young adults, baby bonds aim to break the cycle of intergenerational poverty. In recent years, policymakers in Georgia have taken note: legislation was introduced in 2025 to create a Georgia Baby Bonds program.20 These developments signal growing recognition that wealth building – not just income support must be part of Georgia’s policy toolkit to foster shared prosperity.

“Baby bonds propose to endow every child with a small trust fund at birth, which the child can claim upon reaching adulthood for wealth-building uses.”

View All References

Read More Of The Report

Standing on Business Brief References

1 Staff, Eater. “TKO Closes Its Stall in East Atlanta’s Southern Feedstore.” Eater Atlanta, 3 Aug. 2021, https://atlanta.eater.com/2021/8/3/22607846/atlanta-restaurant-closings-closures.

2 Raymond, Elora Lee, Ben Miller, Michaela McKinney, and Jonathan Braun. “Gentrifying Atlanta: Investor purchases of rental housing, evictions, and the displacement of black residents.” Housing Policy Debate 31, no. 3-5 (2021): 818-834.

3 Richardson, Jason, Bruce Mitchell, and Juan Franco. “Shifting neighborhoods: Gentrification and cultural displacement in American cities.” (2019).

4 Hyra, Derek. “The back-to-the-city movement: Neighbourhood redevelopment and processes of political and cultural displacement.” Urban Studies 52, no. 10 (2015): 1753-1773.

5 Perry, A. M., Donoghoe, M., & Stephens, H. (2023). To increase Black well-being, look to an equitable share of Black-owned employer businesses, https://www.brookings.edu/articles/who-is-driving-black-business-growth-insights-from-the-latest-data-onblack-owned-businesses/

6 Perry, A. M., Donoghoe, M., & Stephens, H. (2023). To increase Black well-being, look to an equitable share of Black-owned employer businesses, https://www.brookings.edu/articles/who-is-driving-black-business-growth-insights-from-the-latest-data-onblack-owned-businesses/

7 Rupasingha, Anil. Locally owned: Do local business ownership and size matter for local economic wellbeing? No. 2013-01. Federal Reserve Bank of Atlanta, 2013.

8 Schnake-Mahl, Alina, Jessica AR Williams, Barry Keppard, and Mariana Arcaya. “A public health perspective on small business development: a review of the literature.” Journal of Urbanism: International Research on Placemaking and Urban Sustainability 11, no. 4 (2018): 387-411.

9 Anchored by a deep commitment to community based participatory research, AWBI completed this brief by conducting interviews with participants who play key roles in their communities as business owners, neighborhood residents, or both in the City of Atlanta. AWBI also analyzed data provided by Dun & Bradstreet Holdings, Inc. and Data Axle, Inc. to examine Black business trends at a neighborhood level. We use this approach because the U.S. Census surveys only report business demographics at the metro level, which limits the analysis of business dynamics on neighborhood well-being.

10 SBA’s Office of Advocacy. “Small Business Profiles for Major Metropolitan Areas,” July 11, 2023. https:// advocacy.sba.gov/2023/07/11/small-business-profiles-for-major-metropolitan-areas.

11 Camardelle, Alex, and Jarryd Bethea. “Building A Beloved Economy: A Baseline and Framework for Building Black Wealth in Atlanta.” Atlanta, Georgia: Atlanta Wealth Building Initiative, November 2023. https://buildblackwealth.into.

12 Headd, Brian. “The Small Business Facts: The Role of Microbusiness Employers in the Economy.” Small Business Administration, 2017; The standard definition of microbusiness is less than 9 employees; however, for the purpose of our analysis, we focus on those that employee as many as 20 employees given the frequency of those businesses in the dataset.

13 Atlanta Wealth Building Initiative analysis of data retrieved from Dun & Bradstreet Holdings, Inc.

14 Camardelle, Alex, and Jarryd Bethea. “Building A Beloved Economy: A Baseline and Framework for Building Black Wealth in Atlanta.” Atlanta, Georgia: Atlanta Wealth Building Initiative, November 2023. https://buildblackwealth.info.

15 Fairlie, Robert W., Alicia Robb, and David T. Robinson. “Black and White: Access to Capital among Minority-Owned Startups.” Working Paper. Working Paper Series. National Bureau of Economic Research, November 2020. https://doi.org/10.3386/w28154.

16 Ramanadhan, Shoba, Sabrina Werts, Collin Knight, Sara Kelly, Justin Morgan, Lauren Taylor, Sara Singer, Alan Geller, and Emma Louise Aveling. “The Role of Small, Locally Owned Businesses in Advancing Community Health and Health Equity: A Qualitative Exploration in a Historically Black Neighborhood in the USA.” Critical Public Health 33, no. 5 (October 20, 2023): 633-45.

17 Ruiz, Cristina, Estefanía Hernández-Fernaud, Gladys Rolo-González, and Bernardo Hernández. “Neighborhoods’ Evaluation: Influence on Well-Being Variables.” Frontiers in Psychology 10 (2019): Article 1736. Accessed July 4, 2024.

18 Shybalkina, luliia. “Place-Based Small Business Support and Its Implications for Neighborhood Revitalization.” Economic Development Quarterly 36, no. 4 (November 2022): 355-70.

19 Rupasingha, Anil. “Locally Owned: Do Local Business Ownership and Size Matter for Local Economic Well-Being?” FRB Atlanta Community and Economic Development Discussion Paper, FRB Atlanta Community and Economic Development Discussion Paper, 2013. https://ideas.repec.org//p/fip/fedacd/ 2013-01.html.

20 lbid.

21 Brookings. “To Increase Black Well-Being, Look to an Equitable Share of Black-Owned Employer Businesses.” Accessed May 29, 2024. https://www.brookings.edu/articles/to-increase-black-well-beinglook-to-an-equitable-share-of-black-owned-employer-businesses.

22 United Way of Greater Atlanta. Child Well-Being Index. Accessed 2024; Comprised of 16 metrics, the Index incorporates data from multiple sources including the Georgia Department of Education, Public Health Department, and U.S. Census. The Child Well-Being Index assesses various aspects of a child’s development, such as education, health, economic equity and stability, and family support.

23 Wiersch, Ann Marie, and Lucas Misera. “2022 Report on Firms Owned by People of Color Based on the Small Business Credit Survey.” Small Business Credit Survey Federal Reserve Banks, no. 20220629 (June 29, 2022). https://doi.org/10.55350/sbcs-20220629.

24 lbid.

25 Corcoran, Emily Wavering, Jordan Manes, Lucas Misera, and Ann Marie Wiersch. “2023 Report on Employer Firms: Findings from the 2022 Small Business Credit Survey.” Small Business Credit Survey Publications, no. 20220308 (March 8, 2022). https://doi.org/10.55350/sbcs-20230308.

26 Camardelle, Alex, and Jarryd Bethea. “Building A Beloved Economy: A Baseline and Framework for Building Black Wealth in Atlanta.” Atlanta, Georgia: Atlanta Wealth Building Initiative, November 2023. https://buildblackwealth.info.

27 Sherman, Fraser. “What Percentage of Rent Should You Pay According to Your Business’ Gross Income?” Chron, March 5, 2019. Accessed July 4, 2024. https://smallbusiness.chron.com/percentagerent-should-pay-according-business-gross-income-71111.html; This article states that while different industries have varying standards, retail operations typically aim for a rent-to-revenue ratio in the range of 5-10 percent.

28 “The State of Storefronts: Alarming Vacancy Rates and Rising Rents during the Pandemic.” Association for Neighborhood and Housing Development. Accessed July 4, 2024. https://anhd.org/report/statestorefronts-alarming-vacancy-rates-and-rising-rents-during-pandemic.

29 Rothwell, Jonathan, Tracy Hadden Loh, and Andre M. Perry. “The Devaluation of Assets in Black Neighborhoods: The Case of Commercial Property.” Brookings Institution, July 11, 2022. Accessed July 4, 2024. https://www.brookings.edu/research/the-devaluation-of-assets-in-black-neighborhoods-the-case-ofcommercial-property.

30 lbid.

Read More Of The Report

Standing on Business Brief: Conclusion and Recommendations

As Atlanta continues its current trajectory of large-scale growth, it is critical that policymakers prioritize systemic solutions that remove the barriers that Black-owned small businesses face. Our conversations with Atlanta’s Black business owners illuminated how business ownership is a vital part of their wealth-building journey. Moreover, this brief demonstrates the deep connection that business owners have to their own neighborhoods and the important role that Black businesses can play in bolstering economic well-being at the neighborhood level.

However, the sustainability and growth of Black-owned businesses face considerable challenges, primarily because of the rising costs of commercial spaces in rapidly gentrifying neighborhoods. The commercial affordability crisis is a pressing issue that threatens to displace legacy Black businesses, thereby eroding the social and economic fabric of Atlanta’s historically Black neighborhoods. As commercial rents soar and the availability of suitably sized and priced retail spaces dwindles, Black business owners are increasingly at risk of being priced out of their neighborhoods. This displacement impacts not only the businesses themselves but also the broader community that relies on them for essential goods, services, and social cohesion.

To safeguard the invaluable contributions of Black-owned businesses to neighborhood well-being, the City of Atlanta’s placemakers, policymakers, philanthropists, and others in the capital and community development ecosystem should pursue the following recommendations:

1. Launch a vacancy tax that will deter unscrupulous investors from purchasing property with limited intent to activate property. As neighborhoods across the city benefit from increased interest from developers, some property owners find it advantageous to hold onto space that would serve as a potential home for small business owners. A vacancy tax, a percentage of the assessed property value, on landowners who allow their commercial properties to remain vacant for extended periods will incentivize the creation of affordable space.

2. Dedicate public funds to support commercial tenant rental assistance.

To support the sustainability of Black-owned businesses in Atlanta’s historically Black neighborhoods and promote neighborhood well-being, the city should establish a Commercial Tenant Rental Assistance Program. This program would provide direct rental subsidies, capital improvement grants, and lease negotiation support to Black-owned businesses struggling with rising commercial rents. Funded by municipal funds, the program would prioritize businesses in historically Black neighborhoods and those demonstrating financial need.

3. Partner with local mission-driven developers to develop smaller retail space and community-owned real estate. The current market availability for retail space often offers too large a footprint for small business owners. This challenge can be addressed by working with local developers seeking to develop small land plots. Their mission-driven and community-based approaches align more closely with residents’ perspectives within a given neighborhood. This can enable the construction of micro-retail spaces and mixed-used developments that offer more affordable commercial space for entrepreneurs. 

4. Enact a legacy business program to support historically Black commercial corridors. Businesses that have served residents for decades are pillars of the community, provide vital resources, and help retain cultural significance. Anchor institutions of 15 years or more can be supported through this program, which may offer landlords subsidies to keep long-term businesses in place, provide marketing and technical assistance, offer grants for renovations, or more. 

5. Establish a strong resource navigator network to help local businesses discover, apply for, and secure capital. We repeatedly heard from small business owners in historically Black commercial corridors that the information for resources is limited and decentralized. Bolstering technical assistance offerings for Black-owned businesses can help address the opportunity divide business owners face when accessing capital, especially concerning tenant costs.

The findings of this study highlight the profound impact that Black-owned businesses have on the well-being of neighborhoods in Atlanta. The presence of these businesses is not only a driver of economic growth but also a crucial factor in enhancing community cohesion and child well-being. Our analysis indicates that for every additional Black-owned business per 1,000 Black residents, the Child Well-Being score increases by approximately 1.8 points, underscoring the significant positive relationship these enterprises exert on Atlanta’s neighborhoods.

In conclusion, preserving and promoting Black-owned businesses is not merely an economic imperative but also a social one. By addressing the barriers to commercial affordability and supporting the growth of these businesses, we can ensure that Atlanta’s neighborhoods continue to benefit from the unique cultural, social, and economic contributions that Black-owned businesses provide. This approach will help foster vibrant, resilient communities where all children and families can thrive.

View All References

Read More Of The Report

The Threats Facing Black Businesses and Neighborhood Well-Being

Threats to Black Businesses
and Neighborhood Well-Being

Given the important role that Black-owned businesses can play as neighborhood assets that are associated with positive well-being outcomes, it is vital to address the structural barriers they continue to face. To investigate these threats, we conducted four focus groups with business owners and residents across the City of Atlanta. The major threats they shared include access to capital and commercial affordability challenges in rapidly gentrifying neighborhoods.

Access to capital barriers

Although most entrepreneurs use personal or family wealth to start their businesses, Black entrepreneurs in Atlanta have fewer resources to do so. Instead, Black entrepreneurs are more likely to rely on personal credit cards to fund their businesses.23 Barriers to bank loans and other sources of capital stemming from chronic of systemic racism and ongoing discrimination in financial markets continue to create barriers to business financing. Even after controlling for creditworthiness, Black entrepreneurs experience higher rates of loan denial and pay higher interest rates than white-owned businesses.24

Nationally, only 20 percent of Black business owners are approved for loans, lines of credit, and cash advances, compared to 33 percent or more for all other racial-ethnic groups.25 In Atlanta, majority-Black neighborhoods receive lower business loan amounts compared to other neighborhoods. According to our 2023 report, “Building a Beloved Economy: A Baseline and Framework for Building Black Wealth in Atlanta,” the more Black residents there are in a neighborhood, the fewer business loans there are.26

Commercial (Un)affordability and Neighborhood Retail

Retail nestled within Atlanta’s neighborhoods was once a standard amenity in Atlanta. However, that amenity is beginning to fade as small Black-owned retailers are priced out of their neighborhoods. If Atlanta intends to combat displacement and help generate community wealth, policymakers and leaders in the capital ecosystem must prioritize supportive policies and investments that promote neighborhood retail.

As rents in the city continue to rise, so does the need to address commercial affordability for small business owners. More work needs to be done to establish a straightforward definition of commercial affordability that reflects the conditions Black businesses face in rapidly gentrifying neighborhoods. A general rule is that businesses should pay at most 10 percent of their annual revenue toward rent.27 However, our analysis shows rent increases in majority-Black neighborhoods may be making affordability a challenge for small Black businesses, compared to other neighborhoods.

Between 2013 and 2023, small businesses in majority-Black zip codes experienced a higher rate of increase in commercial rents compared to those in majority-white zip codes. Specifically, rents in majority-Black zip codes rose by approximately 93 percent, whereas rents in majority-white zip codes increased by approximately 68 percent. This indicates that, relative to their initial values, commercial rents are rising faster in majority-Black zip codes. However, it is essential to note that the absolute increase in rent over the 10-year period was $11.11 in majority-Black zip codes, compared to $15.91 in majority-white zip codes, reflecting the lower initial rent levels in majority-Black zip codes.

Also, between 2013 and 2023, the commercial rents in majority-Black zip codes experienced a compound annual growth rate of approximately 7 percent, compared to approximately 5 percent in majority-white zip codes. This indicates that, on an annual basis, commercial rents in majority-Black zip codes have been increasing faster than those in majority-white zip codes. Small business owners are faced with the instability of commercial rents in majority-Black zip codes, leaving businesses vulnerable to displacement.

Using cost modeling and available market data, we estimate that the median monthly commercial rent for physical space in majority-Black neighborhoods is $6,802. Keeping constant with the 10 percent rule for commercial rents, most Black-owned businesses (62 percent) can afford only $4,167 or less in rent. The commercial space available for rent in majority-Black neighborhoods is not only too expensive but also offers too large a footprint for small business owners. The median square footage available in majority-Black neighborhoods as of the first quarter of 2024 is 3,516 square feet, which is significantly larger than the square footage that business owners stated they need in our conversations.

“I will say that was another thing that brought us to that space. It’s the size, it is very difficult to find small real estate available and that made the rent affordable.” – Atlanta business owner

Commercial vacancies in neighborhoods impact well-being outcomes in addition to their impact on affordability for business owners.28 Vacancy trends reveal that available space in Atlanta’s majority-Black neighborhoods has steadily declined since 2013 and is currently lower than in all other neighborhoods. While this may signal an influx of capital into these neighborhoods, it also implies more competitive rental markets, adding to the pressures existing legacy businesses face.

We are unable to report on what is contributing to lower vacancies in Atlanta neighborhoods, but we can look at trends in the broader real estate market that warrant more analysis and more transparent real estate transaction data. For instance, commercial real estate in majority-Black neighborhoods is often undervalued compared to similar properties in predominantly white areas. This devaluation results in significant aggregate wealth losses for property owners in these communities. This undervaluation makes these properties attractive to larger institutional investors who are based in other neighborhoods, parts of the city, or even, in some cases, the country​.29

Investors might hold properties with the intention of long-term gains rather than immediate resale or leasing, which could skew vacancy data if these properties are not listed as actually vacant. This strategic holding can be part of a broader investment strategy anticipating future appreciation in property values.30 Future studies will identify which businesses are taking over vacant commercial spaces in majority-Black neighborhoods and examine implications for neighborhood well-being when those businesses are not locally owned.

View All References

Read More Of The Report

How Black-owned Neighborhood Businesses Are Assets To the Community

Black-owned neighborhood
businesses are assets to the community

Commonly reported outcomes like household income, educational attainment, and unemployment rates are often analyzed to assess the economic resiliency of a community. These outcomes are helpful for understanding family economic security at the neighborhood level. However, they often overlook the ways systemic economic exclusion of Black communities, through public policies and practices that reinforce structural barriers to wealth creation, can have widespread effects. This includes systemic racial bias in access to business capital in the public and private sectors.14 Moreover, Black-owned businesses are frequently located in disinvested areas, which can be perceived as higher risk by lenders. This geographic bias contributes to the challenges in accessing capital.15

Studies rarely consider the implications of Black-owned businesses as social, economic, and cultural assets that may shape community well-being, but a few have observed the spill-over effect that small businesses can have on their surrounding neighborhoods. For example, neighborhood businesses have been shown to improve community health equity outcomes in historically Black neighborhoods.16 Research shows that evaluations of neighborhood resources, such as local businesses, are linked to residents’ perceptions of their neighborhood and overall well-being.17 Investments in the growth and preservation of neighborhood businesses have also been shown to improve community safety.18 Additionally, places with a higher proportion of local small businesses demonstrate increased per capita income growth and accelerated employment growth.19 Lastly, regions with a higher prevalence of small businesses experience lower levels of income inequality.20

Black-owned small businesses make vital contributions to the culture that influences a neighborhood. These businesses serve as landmarks, gathering spots, and necessary amenities for the community’s residents. In our interviews with Black-owned business owners, the phrase “assets to the community” was used consistently. This embodies how small Black-owned business owners view their relationships with the neighborhoods that they serve. 

Those who start and operate businesses throughout Atlanta’s neighborhoods often live and work within the same community, stating that their business fills a gap or need in services. Despite the ongoing market pressures that make it difficult to open and sustain businesses in Atlanta’s neighborhoods, Black business owners have a strong desire to leverage their businesses as community assets.

This brief builds on the emerging research and recognizes that small, Black-owned businesses are critical neighborhood assets while also considering a more comprehensive and place-based understanding of the impact Black-owned businesses have on neighborhood well-being.21

The Analysis

The analysis uses the United Way of Greater Atlanta’s Child Well-Being Index22 as a dependent variable to examine the relationship between Black-business representation and neighborhood well-being. We employ the Child Well-Being  data as a measure of neighborhood well-being because the scores are generated using data on youth and adult outcomes in health, education, and economic security at the census tract level. The higher the Child Well-Being score, ranging from zero to 100, the more positive the outcomes. A complete list of data points used to construct the Child Well-Being Index can be found in the appendix of this brief.

The independent variable is the number of Black-owned small businesses per 1,000 Black residents, representing the density of Black-owned businesses relative to the share of Black residents in the City of Atlanta neighborhoods. Business-level data was retrieved from Dun & Bradstreet Holdings, Inc. and delivered in a format that includes the racial and ethnic identity of the firm owner, revenues, employee size, and more. We filtered the business dataset to include only those we define as small Black-owned businesses (20 or fewer employees). We geocoded the business-level data to include a corresponding census tract for each business address. Businesses were then organized by census tract and matched to the tract’s Child Well-Being score. Once the data was cleaned and outliers were removed, we analyzed Child Well-Being scores and Black business representation across 130 census tracts in the City of Atlanta.

An ordinary least squares (OLS) regression was performed to estimate the relationship between two variables, where the dependent variable Y is the Child Well-Being score and the independent variable X is the number of Black-owned small businesses per 1,000 Black residents. The result is visualized below.

For each additional Black-owned small business per 1,000 Black residents, the Child Well-Being score is expected to increase by approximately 1.8 points.

This indicates a statistically significant positive relationship between the density of Black-owned businesses and child well-being in Atlanta’s neighborhoods. To put it into perspective, this translates to an approximate 4 percent increase in the Child Well-Being score for each additional Black-owned small business per 1,000 Black residents.

This finding suggests that an increase in the number of Black-owned businesses may be associated with improved neighborhood well-being in Atlanta. While more research is necessary to unpack which specific dimensions of child well-being (employment rates, educational attainment, etc.) are most affected by Black business representation at the neighborhood level, this relationship highlights the potential broader social and economic benefits of supporting the preservation of small Black businesses in neighborhoods. However, market pressures that stimulate displacement, coupled with too few policy protections, threaten the relationship.

View All References

Read More Of The Report

A Snapshot of Atlanta’s Black-Owned Small Businesses

In our conversations with Black Atlanta business owners, small businesses were thought of as local businesses that hired a handful of employees and provided valued services in their neighborhoods.

The United States Small Business Administration (SBA) defines a small business as employing less than 500 people.10 However, the SBA definition produces a sizeable discrepancy in what most would classify as a small business. In our conversations with Black Atlanta business owners, small businesses were thought of as local businesses that hired a handful of employees and provided valued services within their neighborhoods, often referred to by researchers as microbusinesses. This community definition is most in line with our findings that the vast majority — 97 percent — of Black businesses in the City of Atlanta have only one employee.11 To that end, we focus on much smaller businesses in our dataset, given their dominant representation in Atlanta’s local economy, and redefine small Black-owned businesses as businesses that have less than 20 employees.12

View All References

Read More Of The Report

Standing On Business Brief: Pretext & Introduction

Pretext

In November of 2023, Atlanta Wealth Building Initiative (AWBI) set out with a door-to-door strategy to engage Black businesses in Atlanta to share the content within this brief.

We interviewed the owner of BUZZ Coffee and Winehouse, a coffee shop building community in the city’s historic Cascade Heights neighborhood, among others. The owner shared with us that after a five-year tenure and weathering the worst of the pandemic, BUZZ would be closing its doors in less than a week due to a 22.2 percent increase in commercial rent. The news of BUZZ’s closure, alongside the closure of other small businesses across the city,1 inspired AWBI to research the extent of the problem in Atlanta’s neighborhoods. With this brief, we seek to make the case that Black businesses are neighborhood well-being assets that deserve to be shielded from displacement.

Introduction

The closure of Black-owned businesses in Atlanta threatens the core identities and economic vibrancy of the city’s historically Black neighborhoods.2

The displacement of these small businesses is a trend that has been observed over recent decades.3 Migration and economic development patterns intensify market pressures that spur the displacement of businesses in the city’s historically Black neighborhoods.4 Policy debates about the economic stabilization of neighborhoods must include strategies that protect Black-owned small businesses from displacement.5

Atlanta’s ranking as a top hub for Black businesses underscores the need to create a favorable policy environment where they can thrive, which can simultaneously promote well-being in the city’s neighborhoods.6 Studies show that neighborhood small business density affects local economic outcomes; they have the ability to increase per capita income and employment within their localities.7 Moreover, small businesses matter for local economic outcomes as they hire local staff, influence higher levels of perceived neighborhood safety, and provide further broad economic and social benefits for adults and children in the neighborhoods where they operate.8 But while a few studies have examined the impacts of small businesses on neighborhood well-being, very few, if any, have examined the unique impacts of Black-owned businesses.

This brief blends resident and business owner interviews with a rich dataset of Black-owned businesses in the City of Atlanta to examine the relationships between small Black-owned business density and neighborhood well-being.9 The brief also summarizes opportunities and challenges that Black-owned businesses in Atlanta currently face while contextualizing key indicators such as business size, revenues, and more. Drawing parallels between the importance of small businesses and community outcomes allows us to demonstrate the need to protect, invest in, and scale small, Black-owned businesses as a vehicle to bolster community wealth.

Specifically, this report finds that:

  • Black-owned small businesses may significantly improve neighborhood well-being in Atlanta.
  • Black-owned small businesses are being priced out because the size and price of retail space in Atlanta far exceeds what Black-owned small businesses can afford.
  • Atlanta is overdue for policy reforms that establish commercial tenant protections, codify historically Black commercial districts, and protect new and legacy businesses from displacement.

View All References

Read More Of The Report

Roots of Wealth Report Appendix

Roots Of Wealth: Unearthing Black Prosperity in the South

Appendix & References

Appendix

This report includes data from a variety of complex and non-traditional data sources, each with their own limitations and caveats. This appendix is provided as a resource for describing margins of error and other limitations and measures of uncertainty inherent in any dataset obtained through survey or derived through statistical calculation.

While all datasets used in the report have been vetted for accuracy and represent the best-known estimates available for the issue referenced, readers should take care to note where margins of error prevent a precise reading or interpretation of data. Following the description of limitations and caveats for each data source, this appendix provides guidance on which tables and figures utilize the data. It should be noted that additional data points mentioned throughout the report may also be related to the aforementioned sources, even if not explicitly identified here.

All comparisons presented are based on direct estimates, even when derived from surveys with associated margins of error. Users should exercise caution when making definitive comparisons between data points that might have overlapping margins of error and can use The Data Center’s Margin of Error Calculator to determine if two data points are meaningfully different, given stated margins of error. To see the data behind this report, including associated margins of error and other related data, please explore the accompanying data download [link to spreadsheet]. For questions about the data sources or methodology, contact Kindred Futures (belovedresearch@kinfutures.org) or The Data Center (questions@datacenterresearch.org).

State and Local Wealth Estimates

Disaggregated data on wealth is provided by The Data Center, based on the 2018 Survey of Income and Program Participation (SIPP) and the 2018 American Community Survey Public Use Microdata Sample (ACS-PUMS). Given the limited disaggregated wealth data available at geographies smaller than the national level, this data is derived from modeled estimates based on 2018 data designed to align with the most recent complete SIPP survey that does not include data quality warnings.

This report breaks down wealth estimates by metropolitan status, which is used as a proxy for rurality. The definition of metropolitan areas aligns with the USDA Rural-Urban Continuum Codes. While this definition may not fully capture the continuous and nuanced nature of rurality, particularly in areas adjacent to urban areas, it offers a consistent classification of census geographies to allow for comparisons of wealth differences.

The Data Center’s wealth estimates include margins of error, which are provided in the accompanying data file to this report. Users should be aware of data points with overlapping margins of error when making definitive comparisons between estimates, as such differences are unlikely to be statistically significant.

Experienced users of wealth data might note that The Data Center’s modeled wealth estimates may differ from other published sources. These differences are due to methodological choices and underlying data sources. In particular, while SIPP is designed to measure wealth in detail, it includes a smaller sample than the ACS and lacks geographic specificity. The Data Center has verified that differences between modeled estimates and state-level SIPP data are due to compositional differences in the surveyed population between the SIPP and the ACS, with the ACS being a more comprehensive survey of the sub-national population. For more information regarding the methodology used to produce these estimates, see the technical paper accompanying this data.

Survey of Income and Program Participation

The Survey of Income and Program Participation (SIPP) is a nationally representative longitudinal household survey administered by the Census Bureau which reports income, employment, financial status, household characteristics, and wealth. While SIPP data is available at the state level, estimates become less reliable as they are disaggregated due to small subgroup sample sizes. Users should keep this in mind when using SIPP estimates and consider the accompanying margins of error when making comparisons.

Financial Health and Wealth Dashboard

The Urban Institute’s Financial Health and Wealth Dashboard compiles multiple data sources to present disaggregated measures of household financial health, including liquid assets, debt, and net worth and highlights racial disparities in financial well-being. The dashboard relies on statistical models to generate net worth estimates and emergency savings, similar to other sources that utilize statistical models when there is limited data availability on assets and debts at more granular levels. This report utilizes the dashboard’s state-level data on delinquent debt and emergency savings.

While the dashboard’s methodology is similar to other modeled estimates of assets and debts, small differences in methodology can result in different overall values. For example, The Urban Institute provides wealth data at the city level; but with increased granularity comes decreased sample sizes across various demographic groups. This tradeoff results in city-level estimates disaggregated by race only being reported for communities where that race constitutes the majority. This is an effective way to avoid sample size problems for specific demographics, but likely over-emphasizes the racial skew typically inherent in wealth accumulation. The Urban Institute’s variety of estimates in the Financial Health and Wealth Dashboard provides helpful context about financial characteristics in communities with distinct demographic profiles.

American Community Survey

The American Community Survey (ACS), a national survey conducted by the U.S. Census Bureau, provides annual estimates on demographic, social, economic, and housing characteristics. ACS data is available at various geographic levels, though estimates for smaller geographies or subgroups can include substantial margins of error. This is generally not of concern when data is presented at the state level due to larger sample sizes, but users should be cautious when comparing subgroups or small populations over time or across geographies. Data points with margins of error can be found in the accompanying data download file.

Decennial Census

The Decennial Census is a full count of the U.S. population conducted every ten years by the U.S. Census Bureau. It provides data on total population, housing units, and demographic characteristics. While limited in scope compared to the ACS, the Decennial Census is considered a complete count of the population and thus does not have associated margins of error.

Annual Business Survey

The Annual Business Survey (ABS) is a U.S. Census Bureau product which provides detailed data on the demographic characteristics of business owners by race, ethnicity, and sex at various geographies. While the ABS is limited to employer businesses and therefore does not capture the full landscape of informal or non-employer businesses, it is available over time and can give insight into the diversity of business ownership in an area. Note that employer businesses in any metro area will account for the vast majority of business revenues, but only a fraction of the actual businesses in the region.

IPUMS USA

The Integrated Public Use Microdata Series (IPUMS USA) provides anonymized individual- and household-level data from the U.S. Census and American Community Survey (ACS). This data allows for more detailed disaggregation by race, income, age, and geography than the ACS summary tables, but is subject to higher margins of error in smaller subgroups. Users should be cautious when interpreting differences between groups with overlapping margins of error. For example, while Figure 7 shows a higher median home value for White households in North Carolina compared to South Carolina, the overlapping margins of error suggest this difference is unlikely to be statistically significant. The associated margins of error for all IPUMS USA estimates are included in the accompanying downloadable data table.

IPUMS NHGIS

The National Historical Geographic Information System (NHGIS) is a product of IPUMS that harmonizes census data across time and geographies, including Decennial Census variables dating back to the early 20th century. NHGIS provides a consistent framework to examine demographic and housing trends over time. Since most data points included from NHGIS come from Decennial Census, they typically do not have associated margins of error.

Renewing Inequality and Urban Renewal Project Characteristics

The University of Richmond’s Renewing Inequality project compiles information from the federal government’s Urban Renewal Project Characteristics and other various sources from 1955 to 1966 to assess the impact of urban renewal projects on family displacements in select U.S cities.

The authors of the project emphasize that this dataset represents only a fraction of displacements during this period, and that the figures reported to the federal government are often estimates and are considerably lower than figures documented by other urban renewal reports. Additionally, the data reflects displaced families rather than individuals that were displaced through urban renewal.

Several southern cities were selected for inclusion in this report: Atlanta, GA; Birmingham, AL; Jackson, MS; Little Rock, AR; Memphis, TN; Mobile, AL; New Orleans, LA; and Savannah, GA.

Another project by The University of Richmond, Mapping Inequality: Redlining in New Deal America, provides estimates of the percentage of census tracts at the state level that were redlined during the 1930s and 1940s.

Federal Deposit Insurance Corporation

The Federal Deposit Insurance Corporation (FDIC) conducts the biennial Survey of Household Use of Banking and Financial Services, which assesses financial inclusion, such as rates of unbanked and underbanked households at the state level. When the sample size for a state is too small to produce precise estimates, an NA value is presented.

Home Mortgage Disclosure Act

The Home Mortgage Disclosure Act (HMDA) dataset includes detailed records on mortgage applications, approvals, denials, interest rates, and applicant demographics. It should be noted that HMDA does not capture all lenders, and there may be inconsistencies in self-reported demographic information. Data by race is presented for individuals identifying as White alone and Black alone.

Federal Reserve System Banking Deserts Data

This report includes analysis by Kindred Futures of the Federal Reserve System’s Banking Deserts dataset, which identifies census tracts with limited access to brick-and-mortar banking institutions. The dataset is designed to highlight areas where residents may face significant barriers to financial services, such as lack of proximity to bank branches or concentrations of unbanked households. Kindred Futures used this data to examine the geographic distribution of banking deserts across Southern states, particularly in areas with high Black population density. While the data provides important insight into structural gaps in financial infrastructure, users should note that it does not account for informal financial services or access to online banking, which may vary across regions and populations. The original dataset can be accessed through the Fed Communities Banking Desert Dashboard.

National Equity Atlas

The National Equity Atlas is a collaboration between PolicyLink and the USC Equity Research Institute that provides data on racial and economic equity indicators across U.S. geographies. This report utilizes the National Equity Atlas’ indicator on Occupational Segregation, which analyzes 2018-2022 IPUMS USA data to calculate the percentage of workers aged 16+ by race and ethnicity in each occupational group by state. Standard limitations described for the IPUMS USA data apply to this indicator; however, concerns related to sample size are often mitigated by aggregating data across multiple years, as done in this analysis.

Uniform Appraisal Dataset (UAD) Aggregate Statistics

The Uniform Appraisal Dataset (UAD) Aggregate Statistics, released by the Federal Housing Finance Agency (FHFA), provide standardized property-level appraisal data collected through mortgage underwriting processes. These data allow for analysis of appraisal trends across geographic and demographic contexts, including patterns that reflect racial and neighborhood disparities in home valuation. For this report, Kindred Futures analyzed the 2025 UAD Aggregate Statistics to examine appraisal values across communities in the South. While the UAD offers extensive data coverage, it is limited to properties appraised for mortgages purchased or guaranteed by Fannie Mae or Freddie Mac, and does not capture cash sales or loans held in portfolio. Users should note that this dataset is best used to observe aggregate trends rather than individual-level outcomes. More information is available via the Federal Housing Finance Agency.

FEMA National Risk Index

This analysis draws on two publicly available federal data sources. First, the U.S. Census Bureau’s 2023 American Community Survey (ACS) 5-Year Estimates were used to calculate the percentage of the Black population at the census tract level. The ACS provides annually updated demographic, social, economic, and housing data, and is considered reliable for geographic comparisons at the tract level due to its multi-year sampling approach. Second, the Federal Emergency Management Agency’s (FEMA) National Risk Index was used to incorporate each tract’s Community Resilience Score—a composite metric that reflects a community’s capacity to prepare for, respond to, and recover from disasters based on socioeconomic and infrastructure indicators. Kindred Futures combined these datasets to explore how Black population density correlates with resilience scores across communities in the South. Users should note that Community Resilience Scores are modeled and comparative, not absolute measures of resilience.

Housing Wealth Gains Estimates

This analysis uses custom tabulations of the U.S. Census Bureau’s 2018 Survey of Income and Program Participation (SIPP), prepared by The Data Center for Kindred Futures. These tabulations provide state-level estimates of median housing equity by race, enabling the calculation of potential wealth gains if Black homeownership rates matched each group’s share of the state population. To estimate the number of Black households and their population shares, the analysis relies on the U.S. Census Bureau’s 2023 American Community Survey (ACS) 5-Year Estimates. Wealth gains are expressed in 2023 dollars. While these modeled data offer valuable insights into structural housing inequities, users should interpret results with caution. The underlying estimates are sensitive to assumptions about home values, equity shares, and racial population distributions, and are not intended to serve as precise forecasts.

References

1. For the purposes of this report, the Deep South is defined as the states of Alabama, Arkansas, Louisiana, Mississippi, Georgia, Tennessee, Florida, South Carolina, and North Carolina. This delineation is based on both historical and contemporary socio-economic and political contexts. These states share common legacies of segregation, discriminatory lending practices, and underinvestment in Black communities—factors that have contributed to a profound racial wealth divide. By focusing on these states, our analysis captures the region where these challenges are most pronounced and where targeted policy interventions could yield significant improvements. More detail is available in the methodology section of the report.

2. The Data Center analysis of data from the Survey for Income and Program Participation (SIPP), 2018

3. Kindred Futures. 2025. Analysis of Black Household Wealth Using Panel Study of Income Dynamics (PSID) Data. Unpublished dataset analysis.

4. Kindred Futures analysis of data provided by The Data Center

5. Ibid; There are relatively large margins of error, so these differences should be interpreted with caution.

6. Derenoncourt, Hugo, et al. “Changes in the Distribution of Black and White Wealth since the US Civil War.” Journal of Economic Perspectives 37, no. 4 (2023): 71. https://doi.org/10.1257/jep.37.4.71.

7. Kindred Futures analysis of data provided by The Data Center

8. Sim, David C., Joanna E Cohen, Patrick J. Doyle, and Lydia Plath, 2016. “No backward step – Walter Johnson, river of dark dreams: slavery and empire in the cotton kingdom (Cambridge, MA: Harvard university press, 2013). isbn978 0 6740 4555 2.”, Journal of American Studies(1), 50:231-247. https://doi.org/10.1017/s0021875815001942

9. Derenoncourt, Hugo, et al. “Changes in the Distribution of Black and White Wealth since the US Civil War.” Journal of Economic Perspectives 37, no. 4 (2023): 71. https://doi.org/10.1257/jep.37.4.71.

10. Conley, Dalton, 2001. “Decomposing the black‐white wealth gap: the role of parental resources, inheritance, and investment dynamics”, Sociological Inquiry(1), 71:39-66. https://doi.org/10.1111/j.1475-682x.2001.tb00927.x

11. Kindred analysis of data provided by The Data Center (IPUMS; Table: Value & Race of Operator for Southern States, 1920 and 1940)

12. Fahy, Jennifer. “Heirs’ Property and the 90% Decline in Black-Owned Farmland.” Farm Aid, February 28, 2022. https://www.farmaid.org/blog/heirs-property-90-percent-decline-black-owned-farmland/.

13. Francis, Dania V., Darrick Hamilton, Thomas W. Mitchell, Nathan Rosenberg, and Bryce Wilson Stucki, 2022. “Black land loss: 1920–1997”, Aea Papers and Proceedings, 112:38-42. https://doi.org/10.1257/pandp.20221015

14. Shi, Ying, Daniel Hartley, Bhaskar Mazumder, and Aastha Rajan, 2021. “The effects of the great migration on urban renewal”,. https://doi.org/10.21033/wp-2021-04

15. Digital Scholarship Lab, “Renewing Inequality,” American Panorama, ed. Robert K. Nelson and Edward L. Ayers, accessed April 4, 2025, https://dsl.richmond.edu/panorama/renewal/#view=0/0/1&viz=cartogram.

16. Fullilove, Mindy Thompson. “Root shock: the consequences of African American dispossession.” Journal of Urban Health 78 (2001): 72-80.

17. Ibid.

18. Baker, Regina, 2022. “The historical racial regime and racial inequality in poverty in the American south”, American Journal of Sociology(6), 127:1721-1781. https://doi.org/10.1086/719653

19. Kindred analysis of data provided by The Data Center

20. Ibid.

21. Collins, William Job, Nicholas Holtkamp, and Marianne Wanamaker, 2024. “Black Americans’ landholdings and economic mobility after emancipation: evidence from the census of agriculture and linked records”, The Journal of Economic History(4), 84:963-996. https://doi.org/10.1017/s0022050724000299

22. Jones, Elizabeth H., 2017. “Racism, fines and fees and the us carceral state”, Race & Class(3), 59:38-50. https://doi.org/10.1177/0306396817734785

23. Williams, Jakobi, 2023. “Until I am free: Fannie Lou Hamer’s enduring message to America,” The Journal of African American History(4), 108:737-739. https://doi.org/10.1086/726547

24. At Kindred Futures, community wealth building means shifting the focus from individual success to collective prosperity by investing in the economic power of entire communities. We prioritize structural reforms—such as improved access to capital, affordable housing, quality jobs, and supportive business ecosystems—that empower Black households to accumulate and transfer wealth across generations. This approach recognizes that building sustainable, community-driven wealth is key to addressing historical inequities and creating an economy that benefits all.

25. Joint Center for Political and Economic Studies. “Affordability and Availability: Expanding Broadband in the Black Rural South.” Accessed October 17, 2023. https://jointcenter.org/affordability-availability-expanding-broadband-in-the-black-rural-south/.

26. Carpenter, Craig Wesley, F. Carson Mencken, Charles M. Tolbert, and Michael C. Lotspeich, 2019. “Locally owned bank concentration and business start-ups and closures in U.S. metropolitan, micropolitan, and rural counties from 1980-2010”, Review of Regional Studies(1), 50. https://doi.org/10.52324/001c.11479

27. Kindred Futures analysis of data provided by The Data Center; American Community Survey, U.S. Census Bureau; IPUMS

28. Shuaib, Faisal, H. Russell Foushee, John E. Ehiri, Suparna Bagchi, Angela Baumann, and Connie L. Kohler, 2010. “Smoking, sociodemographic determinants, and stress in the Alabama Black Belt”, The Journal of Rural Health(1), 27:50-59. https://doi.org/10.1111/j.1748-0361.2010.00317.x

29. Lichter, Daniel T. and Kenneth M. Johnson, 2023. “Urbanization and the paradox of rural population decline: racial and regional variation”, Socius Sociological Research for a Dynamic World, 9. https://doi.org/10.1177/23780231221149896

30. Hanlon, James, 2011. “Unsightly urban menaces and the rescaling of residential segregation in the united states”, Journal of Urban History(5), 37:732-756. https://doi.org/10.1177/0096144211407744

31. Richardson, Rachel, Damon T. Leach, Natalie M. Winans, David J. Degnan, Anastasiya V. Prymolenna, and Lisa Bramer, 2023. “Race-specific risk factors for homeownership disparity in the continental united states”, Journal of Data Science:591-604. https://doi.org/10.6339/23-jds1116

32. Kindred Futures analysis of data provided by The Data Center; American Community Survey, U.S. Census Bureau, IPUMS

33. Brown, Steven, and Shehryar Nabi. “From Rent to Riches? A Profile on the Wealth and Financial Well-Being of Renter Households.” (2024).

34. Richardson, Rachel, Damon T. Leach, Natalie M. Winans, David J. Degnan, Anastasiya V. Prymolenna, and Lisa Bramer, 2023. “Race-specific risk factors for homeownership disparity in the continental united states”, Journal of Data Science:591-604. https://doi.org/10.6339/23-jds1116

35. Brookings Institution. “How Racial Bias in Appraisals Affects the Devaluation of Homes in Majority‐Black Neighborhoods.” Brookings. Accessed April 3, 2025. https://www.brookings.edu/articles/how-racial-bias-in-appraisals-affects-the-devaluation-of-homes-in-majority-black-neighborhoods/.

36. Rugh, Jacob S., Len Albright, and Douglas S. Massey, 2015. “Race, space, and cumulative disadvantage: a case study of the subprime lending collapse”, Social Problems(2), 62:186-218. https://doi.org/10.1093/socpro/spv002

37. Phillips, Sandra, 2010. “The subprime crisis and African Americans”, The Review of Black Political Economy(3-4), 37:223-229. https://doi.org/10.1007/s12114-010-9078-7

38. Kindred Future analysis of data provided by The Data Center, using 2018 SIPP and 2018 IPUMS USA data. All dollar values are in 2018 dollars.

39. Taylor, Joanna, and Tatjana Meschede. “Inherited prospects: the importance of financial transfers for white and black college‐educated households’ wealth trajectories.” American Journal of Economics and Sociology 77, no. 3-4 (2018): 1049-1076.

40. Schermerhorn, Calvin. “Race for Profit: How Banks and the Real Estate Industry Undermined Black Homeownership.” (2022): 109-110.

41. Charron‐Chénier, Raphaël, 2020. “Predatory inclusion in consumer credit: explaining black and white disparities in payday loan use”, Sociological Forum(2), 35:370-392. https://doi.org/10.1111/socf.12586

42. Kluender, Raymond, Neale Mahoney, Francis Wong, and Wesley Yin. “Medical debt in the US, 2009-2020.” Jama 326, no. 3 (2021): 250-256.

43. Zuzak, Casey, Matthew Mowrer, Emily Goodenough, Jordan Burns, Nicholas Ranalli, and Jesse Rozelle. “The national risk index: establishing a nationwide baseline for natural hazard risk in the US.” Natural Hazards 114, no. 2 (2022): 2331-2355.

44. Kindred Futures analysis of National Risk Index county-level data, Federal Emergency Management Association (FEMA)

45. Emrich, Christopher T., and Susan L. Cutter. “Social vulnerability to climate-sensitive hazards in the southern United States.” Weather, Climate, and Society 3, no. 3 (2011): 193-208.

46. Ferreira, Regardt J., Clare Cannon, Fred Buttell, and T M Davidson, 2023. “Explaining disaster and pandemic preparedness at the nexus of personal resilience and social vulnerability: an exploratory study”, Disaster Medicine and Public Health Preparedness, 17. https://doi.org/10.1017/dmp.2023.78

47. Howell, Junia, and James R. Elliott. “Damages done: The longitudinal impacts of natural hazards on wealth inequality in the United States.” Social problems 66, no. 3 (2019): 448-467.

48. Sabree, Rahkim. “How ‘The Black Tax’ Affects Intergenerational Wealth Transfer.” Forbes. Accessed April 6, 2025. https://www.forbes.com/sites/rahkimsabree/2023/04/08/how-the-black-tax-affects-intergenerational-wealth-transfer/.

49. Kindred Futures analysis of data provided by The Data Center

50. Dill, Janette, and Mignon Duffy. “Structural Racism And Black Women’s Employment In The US Health Care Sector: Study examines structural racism and black women’s employment in the US health care sector.” Health Affairs 41, no. 2 (2022): 265-272.

51. Stelzner, Mark, and Kate Bahn. “Discrimination and monopsony power.” The Review of Black Political Economy 49, no. 2 (2022): 152-174.

52. Couch, Kenneth A., and Robert Fairlie. “Last hired, first fired? Black-white unemployment and the business cycle.” Demography 47, no. 1 (2010): 227-247.

53. Nowotny, Kathryn M., and Anastasiia Kuptsevych‐Timmer. “Health and justice: framing incarceration as a social determinant of health for Black men in the United States.” Sociology Compass 12, no. 3 (2018): e12566.

54. Kindred Futures analysis of data provided by The Data Center

55. Ibid.

56. Brookings. “Black-Owned Businesses in U.S. Cities: The Challenges, Solutions, and Opportunities for Prosperity.” Accessed April 6, 2025. https://www.brookings.edu/articles/black-owned-businesses-in-u-s-cities-the-challenges-solutions-and-opportunities-for-prosperity/.

57. Aram. “Venture Capital Diversity: The Non-Obvious Solution,” April 3, 2023. https://thevcfactory.com/venture-capital-diversity-the-non-obvious-solution/.

58. Yang, Tiantian and Olenka Kacperczyk, 2023. “The racial gap in entrepreneurship and opportunities inside established firms”, Strategic Management Journal(4), 45:745-774. https://doi.org/10.1002/smj.3565

59. Theogene, Edwith, and Christian E. Weller. “Baby Bonds: A Worthwhile Step to Reduce the Racial Wealth Gap.” Center for American Progress, February 20, 2025. https://www.americanprogress.org/article/baby-bonds-a-worthwhile-step-to-reduce-the-racial-wealth-gap/.

60. Quint, Colleen J., and Margaret M. Clancy. “My Alfond Grant CDA: Experience From 10 Years of Automatic Deposits for All Maine Newborns.” (2023)

61. Economic Policy Institute. “Raising the Federal Minimum Wage to $15 by 2025 Would Lift the Pay of 32 Million Workers: A Demographic Breakdown of Affected Workers and the Impact on Poverty, Wages, and Inequality.” Accessed April 6, 2025. https://www.epi.org/publication/raising-the-federal-minimum-wage-to-15-by-2025-would-lift-the-pay-of-32-million-workers/.

62. Madland, David, Christian E. Weller, and Alex Rowell. “Unions Continue To Build Wealth for All Americans.” Center for American Progress, March 20, 2024. Accessed April 6, 2025.

63. David Madland, Christian E. Weller, and Sachin Shiva, Unions Continue To Build Wealth for All Americans (Washington, DC: Center for American Progress, March 20, 2024), https://www.americanprogress.org/article/unions-continue-to-build-wealth-for-all-americans/.

64. Welburn, Jonathan W., Pedro Nascimento de Lima, Krishna B. Kumar, Osonde A. Osoba, and Jonathan Lamb. “Overcoming Compound Racial Inequity: Policies and Costs for Closing the Black-White Wealth Gap.” RAND Corporation, December 7, 2022. https://www.rand.org/pubs/research_reports/RRA1259-2.html.

Read More Of The Report

Policy Pathways: Building Black Wealth Through Structural Change

Policy Pathways:

Building Black Wealth Through Structural Change

Bridging the racial wealth divide in the South will require ambitious, multi-faceted action. The good news is that research and practice offer a menu of proven and promising solutions. These range from direct financial interventions (like baby bonds and down payment assistance) to institutional reforms (like strengthening fair lending enforcement and supporting cooperative ownership models). All these approaches share a common principle: targeting the underlying structures that create and sustain wealth inequality, rather than placing the onus on individuals alone. We recommend a comprehensive strategy centered on community wealth-building, with public policies designed in partnership with Black communities themselves.

Key Pillars of a Black Wealth-Building Agenda for the South

1. Invest in Babies and Youth (Closing the Inheritance Divide): One of the boldest ideas gaining traction is a federal or state-level “Baby Bonds” program. Under baby bond proposals, every child would receive a trust account at birth (with larger deposits for lower-wealth families) that grows over time and can be used in young adulthood for wealth-building purposes (e.g. buying a home, starting a business). Analysis by the Center for American Progress found that a nationwide baby bonds policy, combined with other supports, could shrink the White–Black average wealth ratio from 6:1 today to roughly 1.9:1 by 2060.60 That is a profound improvement. Legislation for baby bonds has been introduced in Congress and in some states across the South, like Georgia, Louisiana, and North Carolina. Given the South’s racial wealth gulf, Southern states should pilot their own baby bond programs or supplement federal ones if enacted. Early estimates suggest a universal baby bond program could provide each Black child from a low-wealth family with $25,000–$30,000 by age 18 – enough for a college tuition or seed capital for a first home. This would directly counteract the lack of inherited wealth that impedes so many Black young adults in the South.

In addition, expanding Children’s Savings Accounts (CSAs) and college savings programs can foster asset-building habits and help families accumulate some wealth for education. Southern states can look to places like Maine that have implemented CSAs for every newborn.61 While typically smaller in scale than baby bonds, CSAs (especially with progressive matching for lower-income families) can narrow the savings divide for Black children. Education-specific funds, paired with scholarships and student debt forgiveness, will reduce the crushing debt loads Black students carry. We strongly support targeted student debt cancellation and greater Pell Grants to enable Black graduates to start their post-college without negative net worth.

2. Boost Black Homeownership and Housing Security: Given housing’s outsized role in wealth, aggressive steps are needed to increase Black homeownership in the South and ensure Black homeowners can build equity on par with others. Policymakers should:

  • Provide Down Payment Assistance and First-Generation Homebuyer Programs: States should create special funds to assist first-time homebuyers who are first-generation homeowners (a disproportionate share of whom are Black or Brown). Research shows that lack of down payment is the top barrier for otherwise qualified Black renters to buy homes.
  • Enforce Fair Lending and Tackle Bias in Mortgage Underwriting: State banking regulators and attorneys general should actively test for discrimination at banks and mortgage companies. The extremely high denial rates for Black applicants documented earlier are not fully explained by credit profiles. Strengthening enforcement of the Equal Credit Opportunity Act and Fair Housing Act is critical. In practice, this means more funding for fair housing organizations to do audit testing, stiff penalties for lenders with unexplained racial disparities, and pushing for inclusion of alternative credit data (like rent and utility payments) to improve Black credit scores. Emerging technology like algorithmic underwriting must also be monitored to ensure it doesn’t perpetuate past bias.

  • Address Appraisal Bias: States can require training and diversified hiring for home appraisers and encourage the use of standards that value homes based on property characteristics, not neighborhood racial makeup. The federal Property Appraisal and Valuation Equity (PAVE) task force has issued guidance on this. Southern cities should pilot review panels for appraisals in communities with large populations of people of color and penalize appraisers who consistently undervalue Black-owned homes.

  • Expand Affordable Housing and Limit Predatory Practices: Inclusionary zoning (requiring new developments to include affordable units) and community land trusts can help more Black families attain stable housing and eventually ownership. Local governments should also crack down on contract-for-deed and rent-to-own scams that have proliferated in the South’s Black communities (these often charge excessive prices and keep deed title until fully paid, with high risk of loss). Preserving existing Black homeownership is as important as creating new owners—this means foreclosure prevention programs, heir property legal assistance (to help families clear titles and keep ancestral land), and property tax relief for long-term low-income owners facing rising taxes due to gentrification.

If these measures are implemented, we could see Black homeownership in the South rise significantly over the next decade – potentially closing the homeownership rate divide by several points. In addition, more equitable home values would increase Black wealth directly. Our analysis indicates that if Black homeownership rates were aligned with their population share, there would be a significant infusion of housing wealth into Black communities. Using state-level data on total owner-occupied units, current Black homeownership figures, and median Black home values, we determined the target number of Black homeowners that would reflect their demographic presence. For example, in Alabama, the divide suggests that an additional 108,250 Black households could become homeowners, potentially adding around $16.24 billion in housing wealth. In Florida, closing this divide could contribute an estimated $127.85 billion in additional housing wealth.

3. Strengthen Financial Infrastructure and Inclusion: Financial inclusion is about ensuring everyone has access to the tools for saving and borrowing at fair terms. To empower Black households in this regard, we recommend:

  • Support CDFIs, MDIs, and Credit Unions: Community Development Financial Institutions (CDFIs) and Minority Depository Institutions (MDIs) (like Black-owned banks) have missions to serve underbanked communities. Southern states should partner with them by depositing some state funds in MDIs, offering loan loss reserves to encourage more small-dollar loans, and funding CDFI-led credit builder programs.
  • Crack Down on Predatory Lending: State legislatures can enact or tighten interest rate caps on payday and title loans (e.g. capping APR at 36% as many states do for military personnel). They can also strengthen regulation of installment lenders and rent-to-own retailers. While some argue these services fill a need, the evidence is clear that they trap borrowers in cycles of debt. Expanding access to small-dollar loans via CDFIs or postal banking could replace predatory lenders with safer options. For medical debt, states should increase charity care requirements for hospitals and support Medicaid expansion (where not adopted) to reduce the burden of unpaid medical bills fueling debt problems.
  • Implement Supportive Tax Policies: States should adopt and expand family-supporting tax credit initiatives—including refundable Earned Income Tax Credits (EITCs), child tax credits, and child care tax credits—to provide direct financial support to low- and middle-income families. By ensuring these tax credits are refundable, states can guarantee that families with little or no tax liability still receive a meaningful benefit. Such measures would increase disposable income, promote savings, and reduce financial stress, thereby empowering families to invest in education, health, and housing—key drivers of long-term wealth accumulation. Enhanced tax credits also serve to counteract structural inequities, as they provide targeted support to communities historically excluded from traditional wealth-building opportunities.

4. Increase Black Incomes and Labor Protections: Income from work may not guarantee wealth, but it’s a necessary foundation. Policies to raise Black incomes and eliminate earnings disparities include:

Raise the Minimum Wage: Several Southern states still use the federal minimum wage ($7.25). Raising it (e.g. to $15 or more gradually) would disproportionately benefit Black workers, who are often in the lowest-paid jobs. Estimates show a $15 minimum would increase Black workers’ earnings by billions and reduce poverty rates significantly in the South.6

  • Strengthen Worker Protections and Unions: Strengthening collective bargaining and worker centers in the South can be a powerful tool for closing the wealth divide. Data from the Federal Reserve’s Survey of Consumer Finances show that the median wealth for a union household is roughly 1.7 times that of a nonunion household, with the biggest percentage boosts going to workers of color and those without a college degree. By securing higher wages, retirement plans, and job stability through collective bargaining, unions help ensure that more families—especially in historically under-resourced communities—build meaningful wealth. States should expand legal protections for organizing, invest in worker centers that educate and advocate for employees, and incentivize employers to bargain responsibly. Efforts such as repealing or reforming “right to work” laws, strengthening labor law enforcement, and supporting multi-employer bargaining models can give Southern workers a true voice in negotiations.63
  • Invest in Job Training and Pipelines to High-Paying Fields: To address the underrepresentation of Black workers in STEM, finance, and management, states should invest in targeted, no-cost  training from high school through mid-career. For example, incentivizing apprenticeships in the trades and advanced manufacturing for Black youth, and partnering with HBCUs on internship pipelines to Fortune 500 companies in the South. The aim is to move more Black workers into careers that offer retirement plans, stock options, and growth potential – crucial ingredients for wealth accumulation.
  • Support Returning Citizens: The South has a high rate of incarceration which has removed many Black men (and women) from the workforce. Re-entry policies that address training, job placement, and seals/restricts records for formerly incarcerated people can help them secure employment, thus contributing to family incomes and stability.

If Black median incomes rise (closing the racial income divide which currently is around 60–70 cents on the dollar), it will have a multiplier effect on wealth over time. More income means more ability to invest in homes, businesses, and education for the next generation.

5. Facilitate Black Business Growth and Asset Ownership: To expand Black entrepreneurship and asset ownership (beyond just housing), we propose:

  • Dedicated Funds for Black Entrepreneurs: States should seed Black business loan funds (or incubators) that provide capital and technical assistance. For example, a Deep South Entrepreneur Fund could pool public, philanthropic, and private dollars to offer low-interest loans to Black-owned startups and expanding firms, administered by CDFIs or MDIs. Similarly, expanding state small business credit initiatives to focus on minority business enterprises can leverage federal dollars to catalyze local lending.
  • Support Cooperative and Community Ownership: Community wealth-building emphasizes collective ownership models as well. Southern cities can encourage development of Black-led worker cooperatives (where workers share profits and equity) and community land trusts (which keep land ownership local and affordable). For instance, Jackson, MS and Atlanta, GA have nascent cooperative movements that could be bolstered through technical support and start-up grants. These models ensure that wealth generated remains anchored in the community. Cities could also expand community ownership of housing (via land trusts or limited equity co-ops) in historically Black neighborhoods to prevent displacement and allow residents to gain equity as a group.
  • Reclaiming Black Land and Agriculture: Given the massive Black land loss documented, efforts to restore and retain land ownership are key. This includes funding legal aid for heirs’ property resolution (to clear titles and avoid forced partition sales), fully implementing the USDA debt relief for farmers of color, and supporting young Black farmers to acquire land. Some nonprofits are facilitating land purchases back to Black farmers – state agriculture departments can partner in these. Retaining land ensures that value appreciates in Black hands rather than being lost. Over time, even modest acreage can be an asset base to leverage for loans or to rent out for income.

The combined effect of these business and asset initiatives would be to increase the share of wealth generated by the Black community that stays in the Black community. More successful Black businesses mean more Black millionaires, more local jobs, and more role models/mentors. It also diversifies the economy, making it more resilient and innovative by tapping talent that is currently under-utilized.

6. Embrace Reparative and Bold Public Policies

Incremental measures alone are unlikely to fully close a wealth divide centuries in the making. Thus, we call on Southern states and cities to consider reparative measures that directly transfer resources to build Black wealth. These could include:

  • Reparations or Wealth Restoration Programs: Following the lead of cities like Evanston, IL (which instituted a housing reparation for Black residents using a marijuana tax), Southern jurisdictions can design reparations to address specific historical injustices. For example, a state might fund reparations for descendants of those who suffered under enslavement, Jim Crow voter suppression and land theft. While comprehensive reparations is a federal endeavor (H.R. 40 and related efforts are ongoing), states can take initiative in piloting programs.
  • Universal Policies with Racial Equity Benefits: Many broad progressive policies would substantially help close racial divides. Examples include medical debt payoff, strengthening Social Security (Black seniors rely heavily on it, having fewer assets), and robust safety nets (child allowances, guaranteed income, etc.). A federal analysis by RAND found that a mix of wealth-building policies (including direct allocations to Black households) totaling about $1.6 trillion would eliminate the median wealth divide – a large sum, but not unimaginable in the context of government budgets (for comparison, the PPP pandemic program was nearly $800 billion). The economic boost from such investment would likely generate new tax revenue over time to offset costs.64
  • Democracy and Power-Building: Lastly, none of these economic policies will be enacted without the political power of Black communities. Protecting voting rights and ending practices that dilute Black votes (gerrymandering, voter suppression) is fundamental. Political capital translates into public investment decisions. States that empower Black voters (like through strong community engagement in budgeting) see more equitable outcomes. Building a movement for Black wealth also means reframing the narrative – as Kindred Futures emphasizes, Black wealth means freedom, and advancing it moves us closer to the beloved community.

Conclusion

The challenge of building Black wealth in the South may seem daunting, but it is also achievable with vision and commitment.

This report has shown that the racial wealth divide is not a result of personal failings or cultural deficiencies; rather, it is the product of deliberate policy choices and systemic biases that have favored one group while disadvantaging another. Therefore, it will take intentional policy interventions to dismantle these barriers and cultivate the roots of Black wealth.

The South cannot reach its full potential while a significant portion of its people are constrained by an unjust wealth divide.

By unearthing Black prosperity, we mean digging into and removing the deep obstacles—much like removing rocks and hardpan soil to let a tree grow deep roots. The policies recommended here form a blueprint for that process. They align with best practices of just economic development: targeted universalism (universal programs designed to lift up the historically marginalized), reparative justice, public investment in human capital, and fostering ownership and agency in communities.

Breaking the wealth-building barriers will require bold action, but the benefits will reverberate across society. When a Black family can purchase a home in a good neighborhood without unfair hurdles, the neighborhood benefits. When a Black entrepreneur can access capital to start a business, she creates jobs and innovation that boost the local economy. When Black children grow up with savings and without crushing debt, they become adults who can spend, invest, and contribute to growth.

The South cannot reach its full potential while a significant portion of its people are constrained by an unjust wealth divide. The time to act is now—before another generation is lost to the compounding effects of inequality. The year 2025 finds us at a crossroads: we can continue on the current path and watch median Black wealth head toward zero, or we can choose the path of shared prosperity and freedom.

The roots of wealth in the South run deep; they have been nourished for some and starved for others. It is time to till the soil, to fertilize the dreams of those who have been denied, and to grow an inclusive prosperity that honors the contributions of Black Americans. In doing so, the South will move closer to the beloved community where, indeed, all can share in the wealth of the earth—fulfilling Dr. King’s vision and securing a brighter future for generations to come.

View All References

Read More Of The Report

The Structural Barriers to Black Wealth-Building Today

Structural Barriers to Black
Wealth-Building Today

Building Black wealth in the South requires navigating a minefield of structural obstacles. These barriers are interrelated and mutually reinforcing. For example, lower incomes make it harder to save for homeownership, which means missing out on home equity gains, which in turn limits capital for entrepreneurship or education for the next generation. In this section we examine several key structural factors—geography, housing, debt, education, employment, and enterprise—illustrating how each contributes to the racial wealth divide. Throughout, the focus remains on community-level structures rather than individual behavior, consistent with a community wealth building perspective.24

Geography and Community Infrastructure

A significant share of Black Southerners live in rural, high-poverty counties—especially in the historic Black Belt stretching from eastern North Carolina through Louisiana and Arkansas. These counties, often majority-Black since Reconstruction, suffer from chronic disinvestment.25 People who live in these counties have limited access to banks, businesses, and broadband that drive wealth in metropolitan areas.26

The map highlights counties (green-shaded areas) that are both predominantly Black and predominantly rural (50% or more rural households). These are concentrated in the Deep South, reflecting how Black residents are more likely to live in rural areas than the national average. In states like Mississippi, Alabama, and Louisiana, entire swaths of Black communities are rural and isolated from economic growth centers.27

Rural Black communities face a double bind of racial and geographic disadvantage. Limited tax bases and exclusionary policy decisions have left many without adequate roads, internet, hospitals, or schools. For example, residents of Alabama’s Black Belt must often drive hours to reach a bank or accredited medical facility.28  Such divides impose extra costs (time, travel, high fees for alternative financial services) that inhibit saving and investment. Fewer employers operate in these areas, contributing to lower home values and out-migration of youth.29

Yet not all urban areas guarantee prosperity either. While cities like Atlanta and Charlotte offer more jobs, Black residents in those cities still contend with segregation, higher costs of living, and discrimination in labor and housing markets.30 

Across much of the Deep South, rural Black households hold wealth on par with— and in several cases modestly above—their metro-area peers. In Florida, for example, the median Black household in non-metro counties reports about $13,000 in wealth versus roughly $7,000 in metro areas; smaller rural gains also appear in Arkansas, North Carolina, Mississippi and Tennessee. These differences may reflect assets such as inherited land, lower living costs, or reduced exposure to gentrification and other urban pressures. Still, most state-level divides are only a few thousand dollars, so additional data are needed to confirm whether the pattern is real or within survey error (see Appendix).

By contrast, White households enjoy a clear metro advantage in every state: in Mississippi, for instance, median White wealth reaches $101,000 in metro areas versus $81,000 in rural counties. The comparison underscores that geography alone does not close racial wealth divides—urban growth continues to translate into larger gains for White residents, while structural barriers limit the returns available to Black families.

Place-based solutions are critical. Investing in rural Black communities (e.g. through targeted federal funds for infrastructure, broadband, and healthcare) can improve the foundation for wealth creation where it’s needed most. At the same time, urban policy must address the fact that

Black residents in cities aren’t automatically sharing in prosperity.

Black Asset Portfolios In The South

Almost everywhere in the Deep South, owning a home is the main way Black families build wealth. In most states a house makes up about a third to half of everything a household owns. But what sits on top of that base changes from place to place. In Mississippi and Arkansas—where good jobs and banks are hard to find—wealth is packed into things you can see and touch: houses, land, and even cars. In Georgia, helped by the economic pull of Atlanta, families have a wider mix: more savings in retirement plans, more money in small businesses, and a bit more in other financial accounts. North Carolina and Tennessee fall somewhere in between.

Relying so heavily on a single item—a house—creates risks. If local home prices slide, a Black family can lose a big slice of its wealth overnight. At the same time, having little money in retirement accounts or small businesses means missing out on other ways to grow wealth over time.

Fixing this calls for practical help. Grants that cover first-time down payments or urgent home repairs can keep housing wealth safe while bringing more people into ownership. Easier, low-cost loans can help Black entrepreneurs grow their companies and spread their bets beyond the family home. And simple, automatic retirement plans at work can help more people set aside money for the long haul. Taken together, these steps would give Black families a sturdier, more balanced path to building and keeping wealth.

Homeownership and Housing Equity

Owning a home has long been the cornerstone of the American wealth-building model – yet for Black Southerners, housing wealth has been elusive. The homeownership divide between White and Black families remains as wide as it was 50 years ago in many Southern states. Several factors contribute to this for Black families: lower incomes and savings for down payments, discriminatory lending (past and present), and residential segregation that has suppressed Black home values.31

Today, White households still make up the large majority of homeowners in every Deep South state. Even in Mississippi – the state with the highest proportion of Black residents – Black families represent only 21% of owner-occupied homes (down from 27% in 2000). States like Georgia and Florida saw a dip in Black homeownership share after the 2008 housing crash, and only slight rebounds since.32

None of these states have regained the Black homeownership levels seen in the 1990s. This matters because homeownership is strongly correlated with wealth: nationally, the median homeowner has 40 times the wealth of the median renter.33 In the South, where property values tend to be lower than  coastal states, home equity still dominates household assets (often 50% or more of total wealth for middle-class families).

Even among homeowners, substantial wealth disparities persist between White and Black households in the Deep South. Each bar pair represents the median wealth of White versus Black homeowners in a given state, and in every case, White homeowners hold more wealth—often two to three times as much. For instance, while Black homeowners in Georgia report one of the highest median wealth levels in the region (about $95,000), it still lags well behind the $257,000 median for White homeowners. The pattern underscores a core finding of this report: homeownership alone does not eliminate the racial wealth divide, indicating that deeper structural factors—such as appraisal bias, historical exclusion from credit, and ongoing discrimination—continue to shape financial outcomes for Black households across the South.

Even when Black families do own homes, those homes are typically worth less on the market than White-owned homes, due to decades of segregation and disinvestment in Black neighborhoods. Our analysis found that across Deep South states, the median value of homes owned by Black households is tens of thousands of dollars lower than the median value of White-owned homes in the same state. In South Carolina, for example, the median Black-owned home is worth about $101,000 less than the median White-owned home. Florida shows the smallest divide (around $20,000, perhaps because many Black homeowners in Florida are in higher-cost markets like Miami), but most states have divides of $50,000 or more. Lower home value means less equity to borrow against for education or business, and less wealth to pass to heirs.

Major drivers of these disparities include:

  • Historic Redlining: 20th-century policies restricted Black buyers to certain areas, often of lower initial value, with limited financing available.34 Those maps of inequality persist today, as homes in formerly redlined (majority-Black) neighborhoods are appraised significantly lower than similar homes in White neighborhoods.
  • Appraisal Bias: Even today, studies show homes in Black neighborhoods are undervalued by 20-23% relative to their features, simply because of racial composition.35 The chart below illustrates a clear negative correlation between a county’s share of Black residents and its average appraised home value: as the percentage of Black population increases, the mean appraised value of homes tends to decrease. Biased appraisals and lower comps mean Black sellers get less and Black owners accumulate equity more slowly.
  • Differential Access to Home Improvements: With less wealth and credit, Black owners may struggle to invest in home repairs or upgrades that increase value. Additionally, cities often invest less in infrastructure (parks, schools, transit) in Black and rural neighborhoods, affecting property values.

Mortgage Denials and Financing

Perhaps the most glaring current barrier is the racial divide in mortgage lending. In every Deep South state, Black applicants are denied home loans at far higher rates than White applicants of similar income. Black denial rates range from 28%–36%, versus 10%–20% for White applicants. These numbers reflect factors like lower average credit scores for Black households, higher debt-to-income ratios, and ongoing discrimination by lenders.36 The result is fewer Black buyers and a continuation of segregated housing patterns. Even those who qualify may face higher interest rates or less favorable terms, meaning they build equity more slowly and pay more over time.

Because of these housing dynamics, Black families in the South miss out on the primary source of wealth-building. Lower homeownership not only means less wealth today, but less intergenerational wealth tomorrow (since homes are a common inheritance or financial safety net). The racial disparities in housing also reinforce other inequities: neighborhoods with low homeownership and wealth tend to have under-resourced schools, fewer businesses, and lower tax revenue, perpetuating a cycle of disinvestment.37 The stability and credit advantages of homeownership (e.g. fixed housing costs, ability to borrow against equity) remain out of reach for many Black Southerners, keeping them more vulnerable to eviction, displacement, and wealth-draining rent payments.

Debt, Credit and Financial Inclusion

Debt Overhang

Many Black households in the South begin their financial lives not with assets, but with debts that outstrip those assets. This was vividly shown in a multi-state study of debt-to-asset ratios: across all age groups, Black families carry significantly higher debt relative to what they own than White families do. In young adulthood (ages 25–34), the typical Southern Black household has debts equal to 150% or more of their assets (meaning their net worth is negative) in states like Florida and Alabama. By comparison, young White households had debt around 60%–80% of assets on average.38

Several structural issues drive these debt disparities:

  • Lower Inherited Wealth: With scant inheritances or family wealth to draw on, Black students often must borrow more for college. Black college graduates average tens of thousands more in student loans than White graduates. This burden delays home-buying and business investment.39
  • Credit Constraints and Predatory Lending: Black communities historically lacked fair access to mainstream credit (due to redlining and lower bank presence). This void was filled by predatory lenders offering high-interest loans (payday lenders, subprime mortgages, auto loans).40 These debts accumulate rapidly. In Black neighborhoods of the South, it’s not uncommon to see clusters of check-cashers and payday loan shops where banks are scarce.41 The result: Black borrowers face higher interest costs and fees, making payoff harder.
  • Income Volatility and Emergency Expenses: Black families, on average, earn less and have less savings, so when emergencies strike (medical bills, car repairs), they must resort to credit. Medical debt is a huge issue in states that did not expand Medicaid (many in the South).42 Uninsured or underinsured Black households often incur medical debts that go unpaid, damaging credit scores and leading to collections
  • Financial Exclusion: About 10%-15% of Black households in several Deep South states have no bank account. Lacking access to basic, low-cost financial services forces reliance on expensive alternatives. For example, without a bank, one might use pawn loans or rent-to-own stores with exorbitant rates, falling deeper into debt. High unbanked rates in places like Mississippi and Louisiana correlate with high levels of delinquent debt.

High Delinquency and Credit Damage

A significant share of Black Southerners live in rural, high-poverty counties—especially in the historic Black Belt stretching from eastern North Carolina through Alabama and Mississippi. These counties, often majority-Black since Reconstruction, suffer from chronic disinvestment. People who live in these counties have limited access to banks, businesses, and broadband that drive wealth in metropolitan areas.

Consequently, Black Southerners are far more likely to have delinquent debt (debt past due or in collections). In every Deep South state, over half of Black households have some delinquent debt on their credit record, compared to roughly one-third of White households. This includes items like unpaid medical bills, defaulted loans, or past-due credit card balances. Figure 12 showcases the uniformity of Black debt delinquency across southern states, which ranges from 50 to 57 percent.

Across the Deep South, more than half of Black households has debt in collection or past due, whereas roughly a third of White households do. This debt overhang impedes wealth-building, as families with damaged credit pay higher interest and struggle to get mortgages or small business loans.

Why does this matter for wealth? High debt and poor credit scores create a vicious cycle. Credit score divides mirror wealth divides: median credit scores for Black adults in Southern states are typically 50–80 points lower than for White adults. For instance, the median Black credit score in Georgia is 628 vs. 710 for Whites. A low score makes it harder to qualify for affordable loans, forcing reliance on subprime lenders and perpetuating high debt costs. It can even affect employment and housing, as many employers and landlords check credit. Thus, addressing the debt burden is central to closing the wealth divide: if Black families must spend a large share of income servicing debt, they cannot save or invest for the future. Additionally, money spent on interest payments to predatory lenders represents wealth flowing out of the community (often into the coffers of distant corporations).

Emergency Savings and Financial Resilience

One indicator of this challenge is the lack of emergency savings. Surveys estimate that fewer Black residents have even a $2,000 rainy-day fund. Figure 13 shows that in every Deep South state, the percentage of Black households with at least $2,000 in savings is far below the percentage of White households. In Mississippi and Arkansas, only about 1 in 3 Black households have $2,000 set aside, versus about 2 in 3 White households. This means Black families are more exposed to financial shocks, which often leads to taking on expensive debt.

Improving financial inclusion—connecting Black communities to safe, affordable banking and credit—is a necessary step toward wealth equity. It involves expanding CDFIs and credit unions, regulating payday lenders, and initiatives like Bank On that encourage low-fee accounts. Without such measures, high debt will continue siphoning off Black income and preventing its conversion into wealth.

Racial Climate Resilience Divide

To deepen our understanding of how racial demographics intersect with climate disaster resilience in the Deep South, we conducted a quadrant analysis using county-level data from FEMA’s National Risk Index.43 The analysis compared each county’s percentage of Black population with its Community Resilience Score, a metric ranging from 0-100 that captures a community’s capacity to prepare for, respond to, and recover from climate disasters. By dividing the data along median values for both variables, we created four distinct quadrants that allow for a clearer picture of where disparities lie.

What emerges from Figure 14 is a striking pattern. The largest group of counties fall into the quadrant characterized by both high percentages of Black residents and low resilience scores. A smaller subset of counties stands out as outliers—those with both high Black populations and high resilience—but these are relatively rare.44 This suggests that while it is possible to build resilience in Black-majority communities, it is not the norm under current conditions.

The implications of this finding for Black wealth in the South are profound. Community resilience is more than a measure of disaster preparedness; it is a reflection of a community’s broader economic and institutional health. In counties where resilience is low, climate disasters like hurricanes are more likely to erode household wealth through property loss, job disruption, or displacement. For Black households in particular—many of whom already face barriers to asset accumulation—this creates a cycle of vulnerability that is hard to escape.45 Even moderate disasters can have outsized effects in these communities, especially when there are limited financial institutions, weak governance structures, and few opportunities for reinvestment.46

Moreover, resilience is closely tied to access: access to credit, to insurance, to reliable infrastructure, and to timely emergency response. In low-resilience, high-Black counties, these forms of access are frequently limited or unevenly distributed. This means that recovery takes longer, costs more, and is more likely to result in long-term displacement or disconnection from community wealth-building assets such as homeownership, local businesses, or inherited property.47 Without targeted investment, these patterns will continue to suppress economic mobility for Black families, perpetuating the racial wealth divide across generations.

Education, Employment, and the Racial Wealth Paradox

Education and employment are traditionally seen as routes to economic success. Black Americans in the South have made significant gains in educational attainment and professional employment over recent decades. However, the wealth divide in the region persists even for those who attain higher education or stable employment, due to structural inequities in the returns on those achievements.

Higher Education – Unequal Returns

College degrees substantially increase earning potential and wealth for Black individuals, but not as much as they do for Whites graduates. In fact, a median Black household headed by a college graduate still has less wealth than a median White household headed by someone with no degree.

One reason is the student debt burden mentioned earlier. Black graduates often begin their careers deep in the red. Another is housing – even a high-income Black professional may face discrimination in home appraisals or mortgage rates, limiting the wealth they can build from real estate. Additionally, Black college grads are more likely to be first-generation wealthy, meaning they might need to assist extended family,48 whereas White grads more often receive inheritances or parental help with home purchases.

Figure 15 shows that even among households where the head has a college degree, White homeownership rates vastly exceed Black homeownership rates in each Southern state. For instance, in Arkansas, 79% of White college grads own homes vs. 56% of Black college grads.49 Lack of homeownership translates to a large wealth divide despite similar education. We see that education is not the “great equalizer” when structures like credit access and housing discrimination intervene.

Labor Market Segmentation

Black workers in the South are overrepresented in lower-wage occupations and underrepresented in higher-paying professions. This stems from both historical segregation in employment and ongoing bias in hiring and promotion. In healthcare, for example, Black employees are much more likely to be nursing aides or home health aides than physicians or pharmacists.

The figure below displays the percentage of each state’s workforce (in various sectors) that is Black. We see Black workers clustering in fields like Healthcare Support (e.g. nursing assistants), Transportation/Material Moving, Food Service, and Building & Grounds Maintenance – jobs that tend to have lower pay and benefits. In Louisiana and Mississippi, over 60% of healthcare support workers are Black, reflecting heavy reliance on Black women’s labor in caregiving roles.50 By contrast, in high-paying STEM or management roles, Black representation is often under 10% (e.g. only 10% of managers in Tennessee are Black).

Unequal occupational distribution means that even with similar education, Black workers often earn less. Pay divides persist within occupations too – research shows Black employees earn less than White employees in the same jobs, due to discrimination and weaker bargaining power.51 Lower earnings make it harder to save, leading to lower wealth.

Unemployment and Underemployment

The Black unemployment rate has historically been about double the White rate, and the South is no exception. During economic downturns, Black workers are often first fired and last rehired.52 Moreover, many Black adults, especially men, have been sidelined from the labor force due to incarceration or health issues rooted in inequality.53 This has led to a phenomenon in some communities where Black women have higher employment rates than Black men.54 Indeed, data show that in every Deep South state, the employment-population ratio for Black women slightly exceeds that for Black men. In states like Florida and Georgia, 70% of Black women are employed compared to 67% of Black men. Black women’s strong work participation is commendable and often necessary for family survival, but because women’s jobs are often lower-paid (e.g. care work), this dynamic can still result in less wealth accumulation than in households with two high-earning spouses.

Education and hard work alone are not enough  to build lasting Black wealth in the South when the rules of the game are rigged. We must rewrite the policies that shape access to opportunity. A more educated Black workforce cannot translate their credentials into wealth parity without changes in the systems around them: equal access to high-paying careers, fair compensation, protection from exploitation, and the ability to leverage income into assets (through homeownership, investments, etc.).

Entrepreneurship and Business Ownership

Entrepreneurship is often touted as a wealth-building path, yet Black business owners face steep uphill battles in the South. A healthy business ecosystem can create jobs and community wealth, but currently, Black-owned employer businesses (those with paid employees) are exceedingly rare in most Southern states. White business owners dominate the landscape, owning 70–82% of all employer firms in the region. By contrast, Black entrepreneurs own only 2–8% of employer firms, despite Black adults comprising 20–35% of the population in these states.55

The underrepresentation of Black businesses is not due to lack of ideas or talent; it stems from lack of capital and structural support:

Access to Capital

Starting or expanding a business requires seed money, collateral, or loans. Due to the wealth divide, the average Black entrepreneur has less personal/family wealth to draw on, and banks often hesitate to lend to those with limited collateral or lower credit scores. Black business owners in the South report difficulties obtaining loans from mainstream banks; many rely on personal savings or high-interest credit.56 Venture capital is even more skewed: nationally, less than 1% of VC funding goes to Black founders.57 This capital divide means Black firms often start smaller and grow slower. Because of historical exclusion, Black entrepreneurs may lack the networks that White entrepreneurs tap into for partnerships, clients, and mentorship. Southern states have a history of nurturing incubators and Chambers of Commerce for minority businesses (e.g. in Atlanta), but these resources need scaling across the region.

Historical Prejudices

For decades, Black-owned businesses were confined to serving Black customers in segregated markets, limiting their growth. Post-integration, many Black businesses struggled to compete with larger White-owned firms that had better financing. The closure of numerous Black banks and insurers in the late 20th century also constricted funding channels. The legacy is a smaller Black business sector overall.

Georgia and Florida stand out as modest bright spots: Georgia has about 7% of firms Black-owned – likely influenced by Atlanta’s high concentration of Black entrepreneurs. Still, even in Georgia, Black residents are 32% of the population and only 7% of business owners. Mississippi has the lowest shares (5%), which is striking given Mississippi’s Black population size. This points to severe structural barriers in those states’ business environments.

The dearth of Black-owned businesses matters for wealth because entrepreneurship can yield substantial returns and create community jobs. When business ownership is so skewed, it reinforces the wealth divide: White owners accumulate profits and equity, while Black workers earn wages. Additionally, Black-owned firms are more likely to hire Black employees, so fewer Black businesses mean fewer employers who might proactively invest in Black communities.58

Summary: The Structural “Web” Underlying the Wealth Divide

The structural barriers outlined above do not operate in isolation – they compound. A hypothetical example illustrates this web of disadvantage: Imagine a Black college graduate in Alabama. She finishes school with significant student loans (debt), struggles to find a high-paying job in her field due to subtle hiring bias (employment barrier), ends up taking a job that doesn’t build wealth (occupational segregation), rents an apartment because she can’t afford a home down payment (housing barrier), accumulates little savings while servicing student debt (debt again), and can’t fall back on family wealth (historical divide). Even though she “did everything right” individually (got an education, worked hard), the structures around her limited each wealth-building step.

Having examined these barriers, the next section of this report turns to solutions. Encouragingly, evidence suggests that bold policies can produce major gains. For instance, new “baby bond” proposals would provide children with seed capital that, by adulthood, could substantially equalize wealth starting points. Reparative housing programs and debt forgiveness can free up Black income for saving rather than loan payments. The final section outlines a comprehensive policy framework – a kind of Marshall Plan for Black wealth – to address the intertwined factors we have discussed.

View All References

Read More Of The Report